âHello, after lots of time looking over these questions, I am still not quite grasping numbers 1-6. If I could get some assistance it would be much appreciated, thank you.
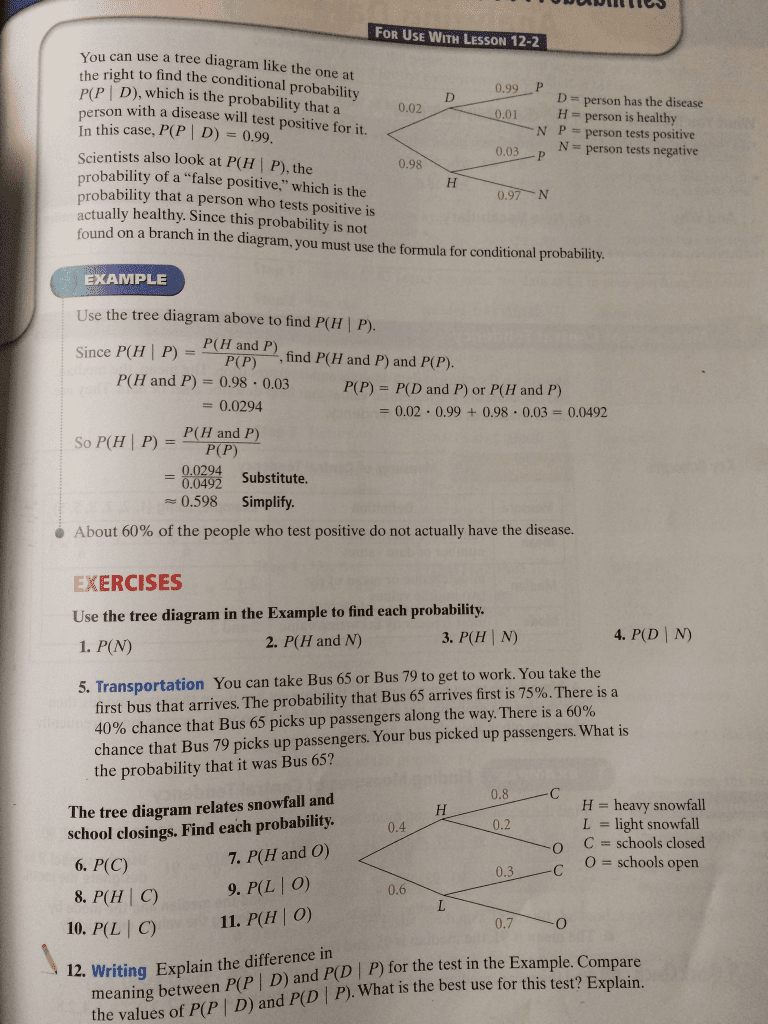
FOR USE WITH LESSON 12-2 You can use a tree diagram like the one at the right to find the conditional probability P(P | D), which is the probability that a 0.99 P D = person has the disease rson with a disease will test positive for it. In this case, P( D) = 0.99 Scientists also look at P(H | P), the robability of a "false positive," which is the probability that a person who tests positive is actually healthy. Since this probability is not found on a branch in the diagram, you must use the formula for conditional probability. 0.02 person is healthy N P person tests positive 0.03P N person tests negative 0.98 0.97 N EXAMPLE Use the tree diagram above to find P(H | P). Since P(H | P) P(H and P find P(H and P) and P(P) P(H and P) - 0.98. 0.03 PP) P(D and P) or P(H and P) 0.0294 = 0.02 , 0.99 + 0.98 . 0.03 0.0492 So P(H P) = P(Hand P) P(P) 0.0294 Substitute 0.598 Simplify. About 60% of the people who test positive do not actually have the disease. EXERCISES Use the tree diagram in the Example to find each probability. 1. P(N) 3. P(H N) 4. P(D N) 2. P(H and N) 5. Transportation You can take Bus 65 or Bus 79 to get to work. You take the first bus that arrives. The probability that Bus 65 arrives first is 75%. There is a 40% chance that Bus 65 picks up passengers along the way. There is a 60% chance that Bus 79 picks up passengers. Your bus picked up passengers. What is the probability that it was Bus 65? The tree diagram relates snowfall and school closings. Find each probability.0.4 6. P(C) 8. P(H | C) 0.8 H heavy snowfall L = light snowfall C= schools closed O schools open 0:2 0 7. P(H and O) 9. P(L | O) 0.6 10. P(L IC) 11. P(H O) 12. Writing Explain the difference in 0.7 the test in the Example. Compare meaning between P(P | D) and P(D |P) for the values of P(P | D) and P(D |P) What is the best use for this test?