BI308 Lecture Notes - Lecture 22: Parental Investment

Document Summary
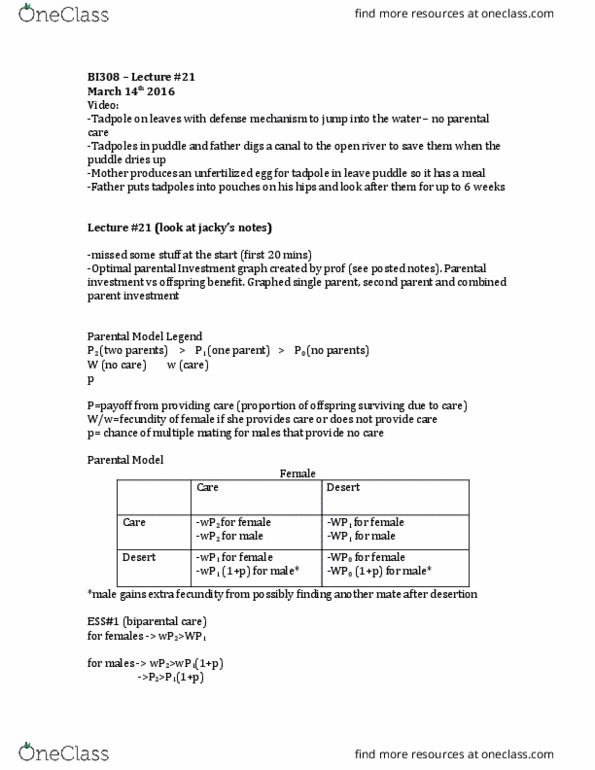
Missed some stuff at the start (first 20 mins) Optimal parental investment graph created by prof (see posted notes). Graphed single parent, second parent and combined parent investment. P2 (two parents) > p1 (one parent) > p0 (no parents) P=payoff from providing care (proportion of offspring surviving due to care) W/w=fecundity of female if she provides care or does not provide care p= chance of multiple mating for males that provide no care. *male gains extra fecundity from possibly finding another mate after desertion. Ess#1 (biparental care) for females -> wp2>wp1 for males -> wp2>wp1(1+p)