BIO120H1 Lecture Notes - Lecture 6: Survivorship Curve, P53, Semelparity And Iteroparity


36
BIO120H1 Full Course Notes
Verified Note
36 documents
Document Summary
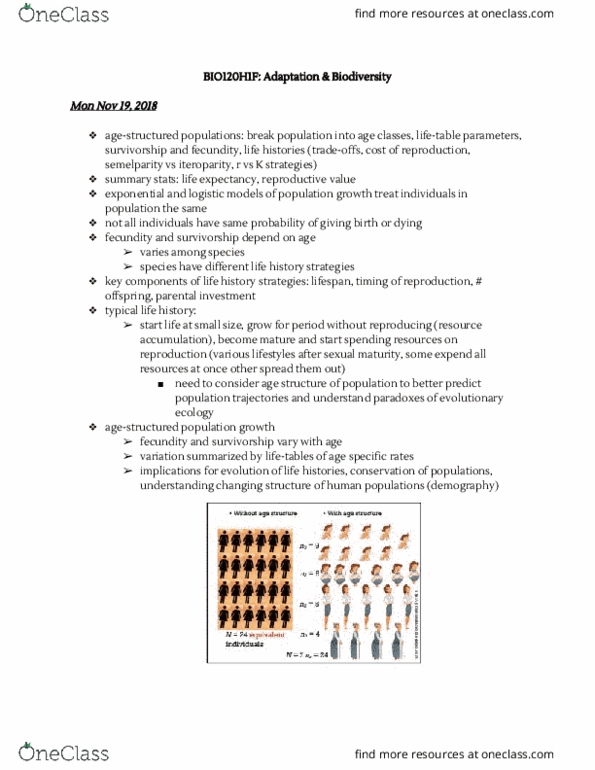
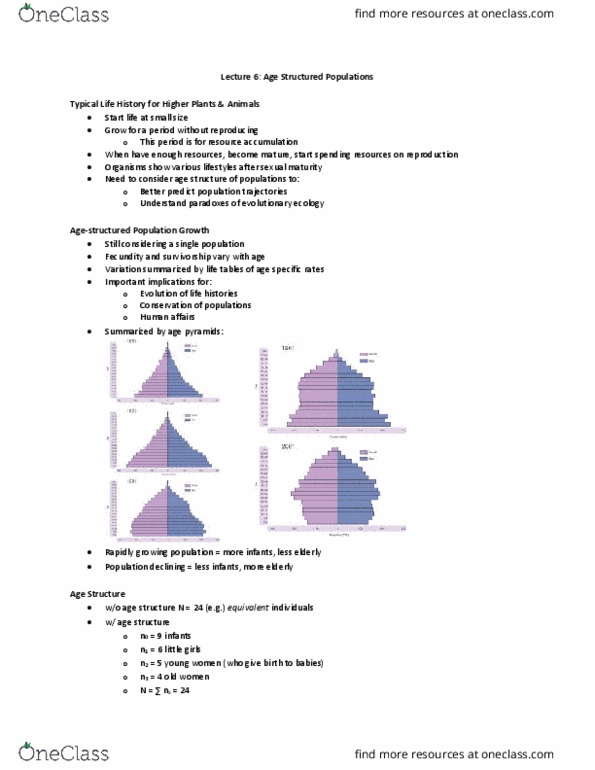
Typical life history for higher plants & animals. Grow for a period without reproducing (for resource accumulation) When they have enough resources, they become mature, start spending resources on reproduction. Organisms show various lifestyles after sexual maturity. Need to consider age structure of populations to. Variation summarized by life tables of age specific rates. If birth & death rates stay constant, pyramid shape is stable. Each number in nx represents an age group. Arbitrary units of time chosen to give a reasonable number of age classes for the organism in question. Date summarize the life events that are statistically expected for the average individual of a specified age in a population. Lx = probability of being alive at age x. Survivorship curve = graph of lx vs. x. Shape of lx curve is characteristic of species. Type 1 survivorship: exhibit high survivorship throughout their life cycle.