MATH 1P98 Lecture Notes - Lecture 4: U96

13 Oct 2018
School
Department
Course
Professor
MATH 1P98 verified notes
4/27View all
Document Summary
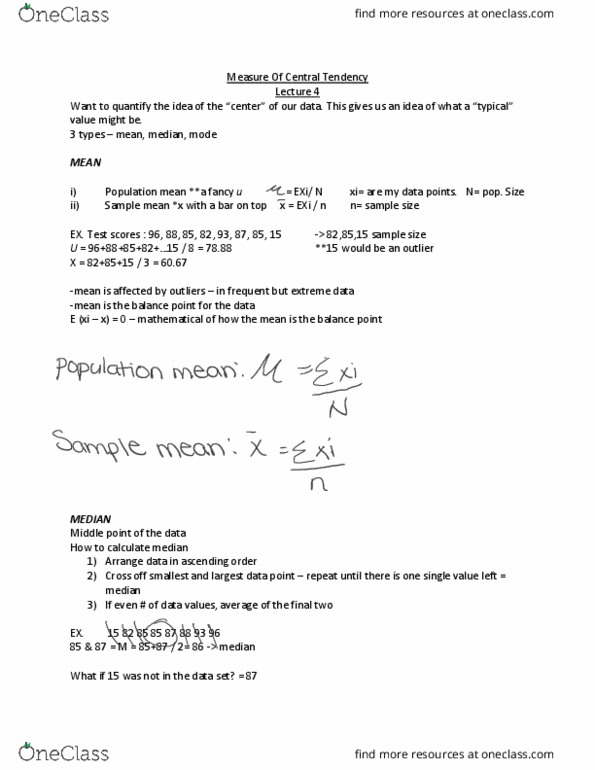
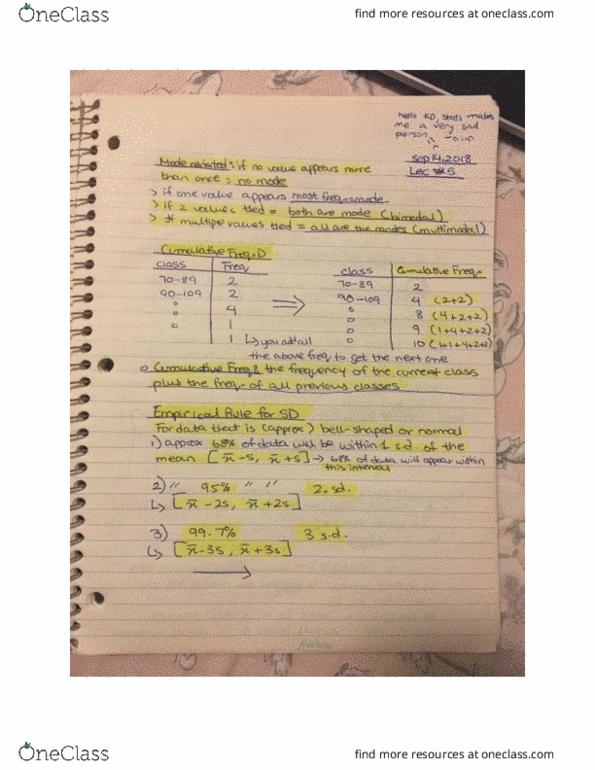
Want to (cid:395)uantify the idea of the (cid:862)cente(cid:396)(cid:863) of ou(cid:396) data. This gi(cid:448)es us an idea of (cid:449)hat a (cid:862)typical(cid:863) value might be. Sample mean *x with a bar on top. = exi/ n x = exi / n xi= are my data points. Test scores : 96, 88, 85, 82, 93, 87, 85, 15. U = (cid:1013)(cid:1010)+(cid:1012)(cid:1012)+(cid:1012)(cid:1009)+(cid:1012)(cid:1006)+ (cid:1005)(cid:1009) / (cid:1012) = (cid:1011)(cid:1012). (cid:1012)(cid:1012) Mean is affected by outliers in frequent but extreme data. Mean is the balance point for the data. E (xi x) = 0 mathematical of how the mean is the balance point. How to calculate median: arrange data in ascending order, cross off smallest and largest data point repeat until there is one single value left = median, if even # of data values, average of the final two. 85 & 87 = m = 85+87 / 2= 86 -> median. The most frequent value in the data set.