16657 Lecture Notes - Lecture 3: Market Risk, Efficient Frontier, Standard Deviation

Document Summary
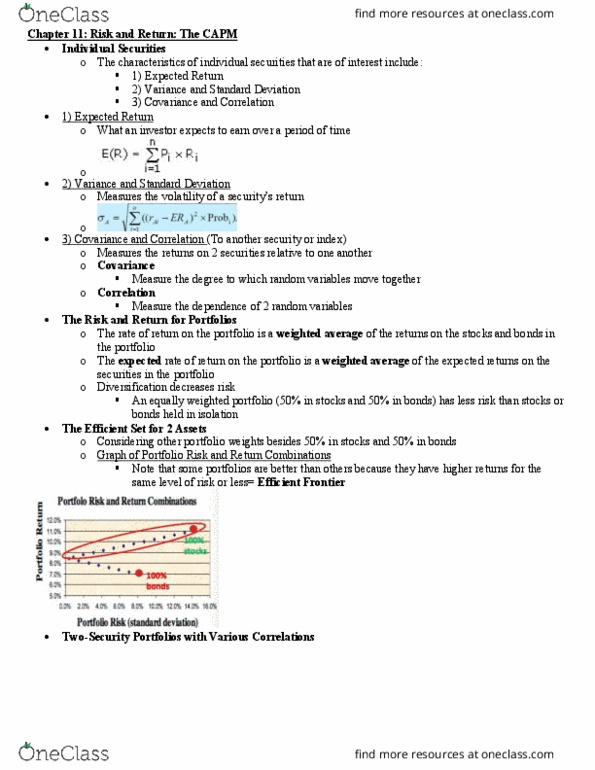
Explain combination lines including examples of perfect negative & correlation plus other types of correlation. A combination line plots expected returns of a two security portfolio against the standard deviation of that portfolio. The combination line shows how the expected risk and return of a two security portfolio has an effect on the weights. Id securities a and b were perfectly correlated the correlation coefficient would be +1 and conversely id they were perfectly negatively correlated the correlation coefficient would be. Explain the minimum variance set and the efficient set. Minimum variance set there is a large number of possible combinations and weighting of securities within a portfolio. This combination is based on how much risk an investor is willing to take. Therefore, the investment opportunity set has a parameter which is represented by the bullet shaped curve referred to as the minimum variance set. Each point along this curve represents a portfolio with individual weightings allocated to each security.