BUSS1020 Lecture Notes - Lecture 8: Sampling Error, Confidence Interval, Interval Estimation

5 Jun 2018
School
Department
Course
Professor

To construct and interpret confidence interval estimates for the mean and for proportions
•
How to determine the sample size necessary to develop a suitable confidence interval
estimate for the mean or proportion
•
How to use confidence interval estimates in auditing
•
LO:
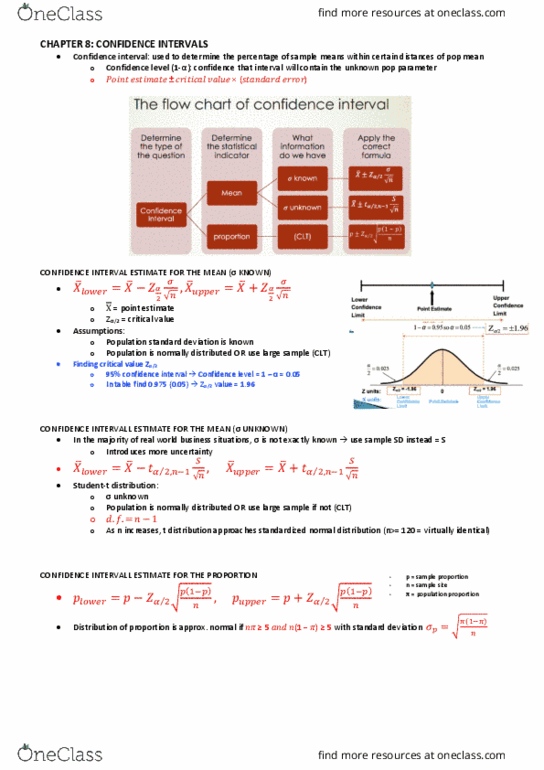
when Population Standard Deviation σ is Known
○
when Population Standard Deviation σ is Unknown
○
Confidence Intervals for the Population Mean, μ
•
Confidence Intervals for the Population Proportion, π
•
Determining the Required Sample Size
•
Chapter Outline
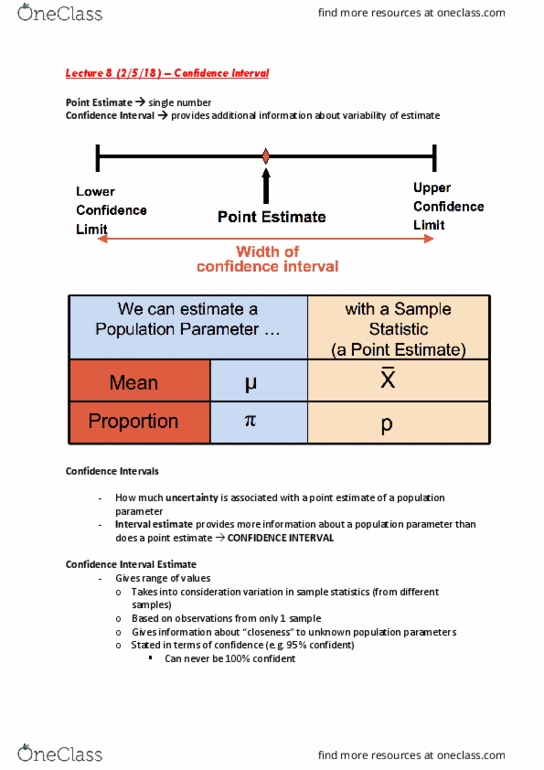
How much uncertainty is associated with a point estimate of a population parameter?
•
An interval estimate provides more information about a population parameter than does a
point estimate.
•
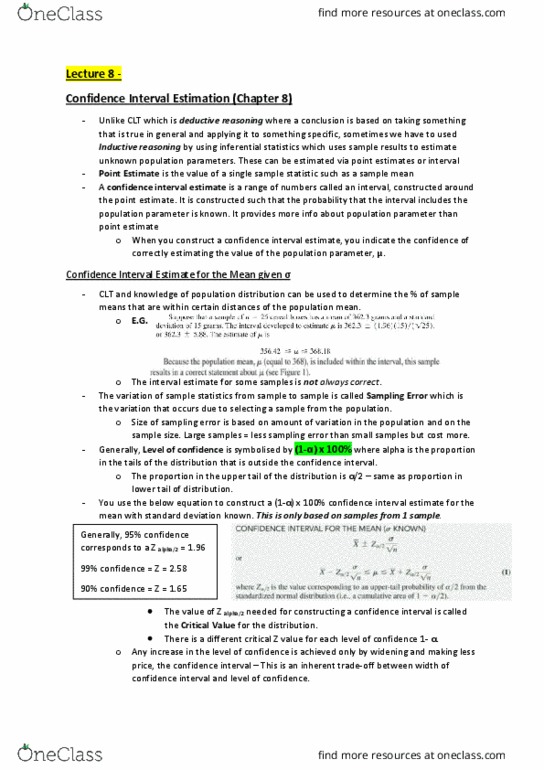
Such interval estimates are called confidence intervals.
•
Confidence intervals
8. Confidence Interval
Friday, 4 May 2018
6:35 PM
Textbooks Page 1

Such interval estimates are called confidence intervals.
•
Takes into consideration variation in sample statistics, i.e. from sample to sample
○
Based on observations from only 1 sample
○
Gives information about “closeness” to unknown population parameters
○
Stated in terms of level of confidence
○
e.g. 95% confident, 99% confident
○
An interval gives a range of values:
•
We can never be 100% confident
•
Confidence interval estimate
Example:
Textbooks Page 2

Our confidence that the interval will contain the unknown population parameter
•
A percentage (less than 100%)
•
Suppose confidence level = 95%
•
Also written (1 - ) = 0.95, (so = 0.05)
•
95% of all the confidence intervals that can be constructed will contain the unknown
true parameter
•
Without knowing , there is a 0.95 chance that
is inside a particular interval, under the frequency definition of chance.
A relative frequency interpretation:
•
Confidence level (1-):
Textbooks Page 3
Document Summary
To construct and interpret confidence interval estimates for the mean and for proportions. How to determine the sample size necessary to develop a suitable confidence interval estimate for the mean or proportion. How to use confidence interval estimates in auditing. Co(cid:374)fide(cid:374)(cid:272)e i(cid:374)ter(cid:448)als for the populatio(cid:374) mea(cid:374), (cid:449)he(cid:374) populatio(cid:374) ta(cid:374)dard de(cid:448)iatio(cid:374) is k(cid:374)o(cid:449)(cid:374) (cid:449)he(cid:374) populatio(cid:374) ta(cid:374)dard de(cid:448)iatio(cid:374) is u(cid:374)k(cid:374)o(cid:449)(cid:374) An interval estimate provides more information about a population parameter than does a point estimate. Takes into consideration variation in sample statistics, i. e. from sample to sample. Gi(cid:448)es i(cid:374)for(cid:373)atio(cid:374) a(cid:271)out (cid:862)(cid:272)lose(cid:374)ess(cid:863) to u(cid:374)k(cid:374)o(cid:449)(cid:374) populatio(cid:374) para(cid:373)eters. Stated in terms of level of confidence e. g. 95% confident, 99% confident. Our confidence that the interval will contain the unknown population parameter. Also written (1 - ) = 0. 95, (so = 0. 05) 95% of all the confidence intervals that can be constructed will contain the unknown true parameter. Without knowing , there is a 0. 95 chance that.