BUSS1020 Chapter Notes - Chapter 8: Confidence Interval, Standard Deviation, Point Estimation

28 May 2018
School
Department
Course
Professor
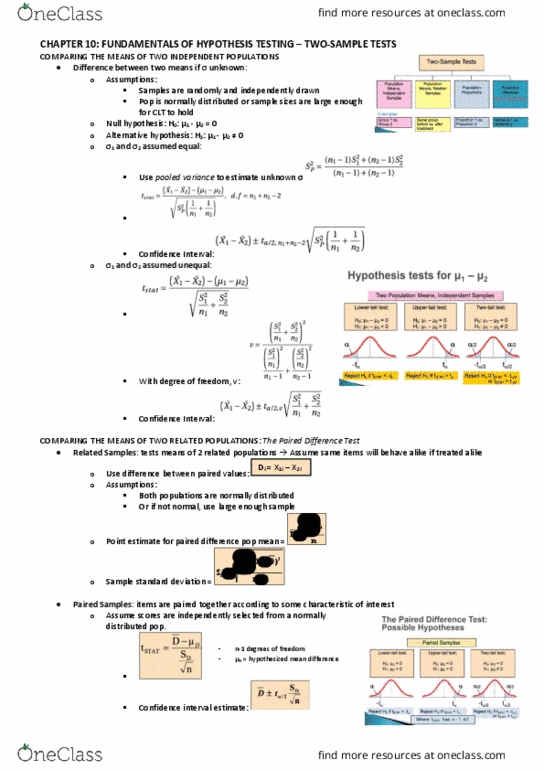
CHAPTER 8: CONFIDENCE INTERVALS
• Confidence interval: used to determine the percentage of sample means within certain distances of pop mean
o Confidence level (1-α): confidence that interval will contain the unknown pop parameter
o
!"#$%
&'%#()%&
±
*+#%#*),
-),.&
× (
'%)$/)+/
&++"+
)
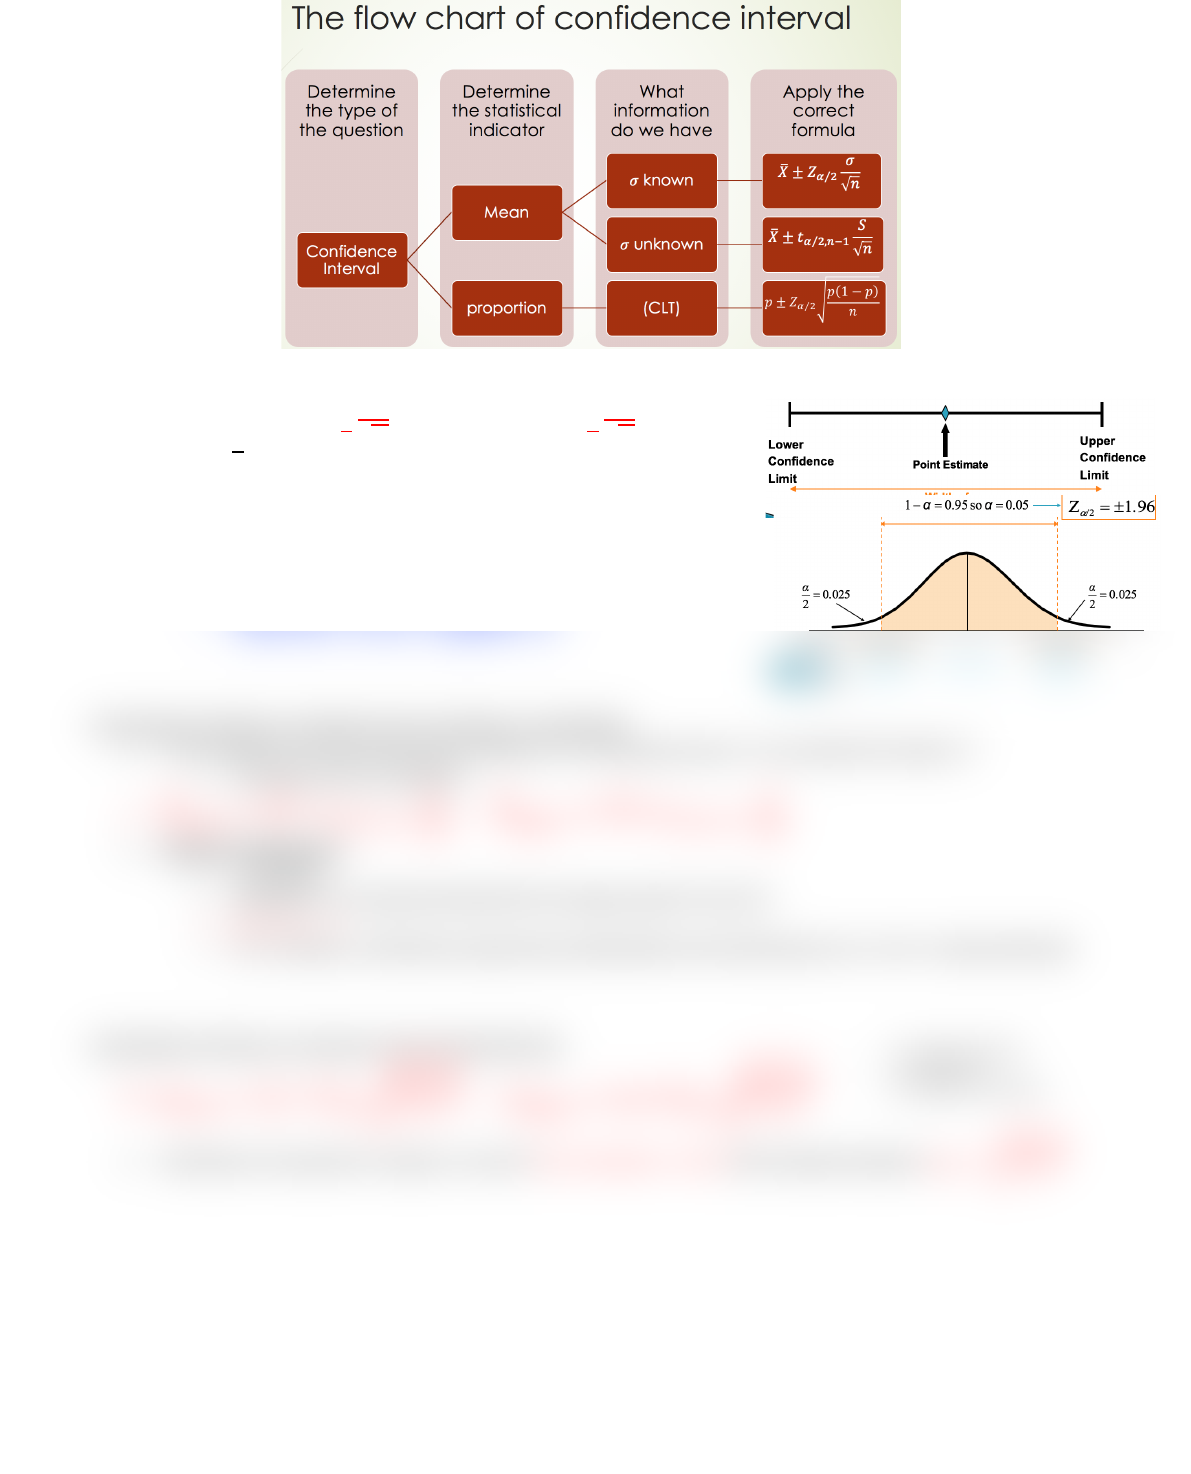
CONFIDENCE INTERVAL ESTIMATE FOR THE MEAN (σ KNOWN)
•
0
1
23456 7 0
1
89:
;<
=
>
?
@0
1
ABB56 7 0
1
C9:
;<
=
>
?
o
D?
= point estimate
o Zα/2 = critical value
• Assumptions:
o Population standard deviation is known
o Population is normally distributed OR use large sample (CLT)
• Finding critical value Zα/2
o 95% confidence interval à Confidence level = 1 – α = 0.05
o In table find 0.975 (0.05) à Zα/2 value = 1.96
CONFIDENCE INTERVALL ESTIMATE FOR THE MEAN (σ UNKNOWN)
• In the majority of real world business situations, σ is not exactly known à use sample SD instead = S
o Introduces more uncertainty
•
0
1
23456 7 0
1
8%E F@>GH
I
J
=
>@
?????
0
1
ABB56 7 0
1
C%E F@>GH
I
J
=
>
• Student-t distribution:
o σ unknown
o Population is normally distributed OR use large sample if not (CLT)
o
/KLK7$8M
o As n increases, t distribution approaches standardized normal distribution (n>= 120 = virtually identical)
CONFIDENCE INTERVALL ESTIMATE FOR THE PROPORTION
•
N23456 7N89E F
IO
B
P
HGB
Q
>@
?????
NABB56 7 NC9E F
IO
B
P
HGB
Q
>
• Distribution of proportion is approx. normal if
$R
≥ 5
)$/
$
(1 −
R
) ≥ 5 with standard deviation
SB7
O
T
P
HGT
Q
>
- p = sample proportion
- n = sample size
- π = population proportion