L33 Psych 300 Chapter 8: Confidence Intervals, Effect Size, and Statistical Power

18 Feb 2019
School
Department
Course
Professor
Chapter 08: Confidence Intervals, Effect Size, and Statistical Power
Confidence Intervals
●Point Estimate - a summary statistic from a sample that is just one number used as an
estimate of the population parameter
●Interval Estimate - based on a sample statistic and provides a range of plausible values
for the population parameter
●Calculating Confidence Intervals with Z Distributions
○Step #1: Draw a picture of a distribution that will include the confidence interval
○Step #2: Indicate the bounds of the confidence interval on the drawing
○Step #3: Determine the z statistics that fall at each line marking the middle 95%
○Step #4: Turn the z statistics back into raw means
○Step #5: Check that the confidence interval makes sense
Effect Size
●The Effect of Sample Size on Statistical Significance
○Statistical Significance - rejecting the null hypothesis means that we have
determined that an observed result is unlikely to have occurred by chance, if the
null hypothesis were actually true
○Statistical Significance is another term for ‘rejecting the null hypothesis’
○Statistical Significance does not
necessarily indicate practical importance
●Effect Size - indicates the size of a difference and is unaffected by sample size
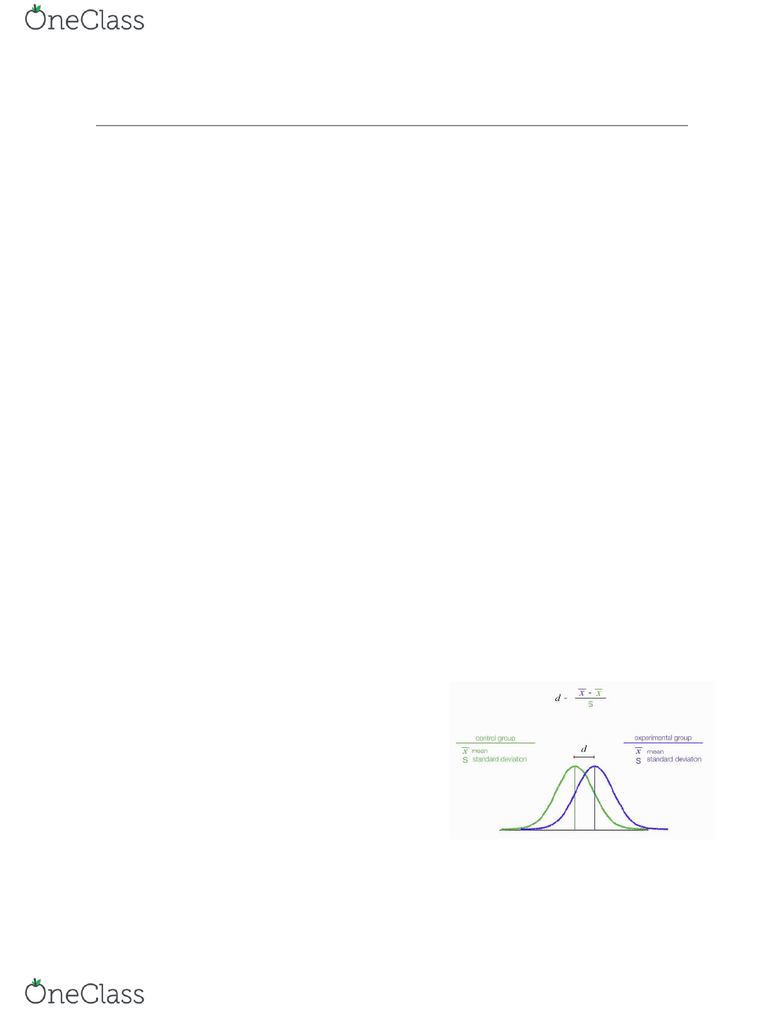
○The less overlap between curves, the bigger the effect size
○If you have a large enough sample size (N), even a very small real difference in
population means will turn out to be statistically significant
○Effect Size is based on two things:
■The size of the difference between means
■Variability in distributions being compared
○The less
overlap between distributions, the larger
the effect
●Cohen’s D - a measure of effect size that assesses the difference between two means in
terms of standard deviation, not standard error
○Assesses the difference between means
using population standard deviation
instead of standard error (of sampling
distribution)
○The population standard deviation is not
affected by sample size, whereas
standard error is affected by sample size
- meaning that a z-score can change
dramatically based on a sample size but
the Cohen’s D score will not
■A more extreme z-statistic does not
indicate a larger effect size or a
rejection of the null hypothesis
find more resources at oneclass.com
find more resources at oneclass.com
Rough Guideline on what’s a small, medium, or large Cohen’s D
Effect Size
Convention
Overlap
Small
0.2
85%
Medium
0.5
67%
Large
0.8
53%
●Meta-Analysis: a study that involves the calculation of a mean effect size from the
individual effect sizes of many studies
○Step #1: Select the topic of interest, and decide exactly how to proceed before
beginning to track down studies
○Step #2: Locate every study that has been conducted and meets the criteria
○Step #3: Calculate an effect size, often Cohen’s D, for every study
○Step #4: Calculate statistics - ideally, summary statistics, a hypothesis test, a
confidence interval, and a visual display of the effect sizes
Statistical Power
●Statistical Power - a measure of the likelihood that we will reject the null hypothesis,
given that the null hypothesis is false
○If we have an alpha of .05, what is the probability of having a Type I error?
■The probability is equal to the alpha, so it is .05
Null Hypothesis is True (no
effect)
Null Hypothesis is False
(effect)
Reject Null Hypothesis
Type I Error (false alarm)
Probability = alpha
Correct!
Probability = 1 - B (called
power) usually aim for power
at around .80 or 80%
Fail to Reject the Null
Hypothesis
Correct!
Type II Error (miss)
Probability = B
●The Importance of Statistical Power
○Step #01: determine the information needed to calculate statistical power - the
hypothesized mean for the sample; the population mean; the population standard
deviation; and the standard error based on this sample size.
○Step #02: determine a critical value in terms of the z distribution and the raw
mean so that statistical power can be calculated
○Step #03: calculate the statistical power - the percentage of the distribution of
means for population 1 (the distribution centered around the hypothesized
sample mean) that falls above the critical value
find more resources at oneclass.com
find more resources at oneclass.com
Document Summary
Somehow make the difference between population means bigger. Chapter 08: confidence intervals, effect size, and statistical power. Point estimate - a summary statistic from a sample that is just one number used as an estimate of the population parameter. Interval estimate - based on a sample statistic and provides a range of plausible values for the population parameter. Step #1: draw a picture of a distribution that will include the confidence interval. Step #2: indicate the bounds of the confidence interval on the drawing. Step #3: determine the z statistics that fall at each line marking the middle 95% Step #4: turn the z statistics back into raw means. Step #5: check that the confidence interval makes sense. The effect of sample size on statistical significance. Statistical significance - rejecting the null hypothesis means that we have determined that an observed result is unlikely to have occurred by chance, if the null hypothesis were actually true.