STA 309 Chapter Notes - Chapter 7-8: Sampling Frame, Probability Distribution, Central Limit Theorem

Document Summary
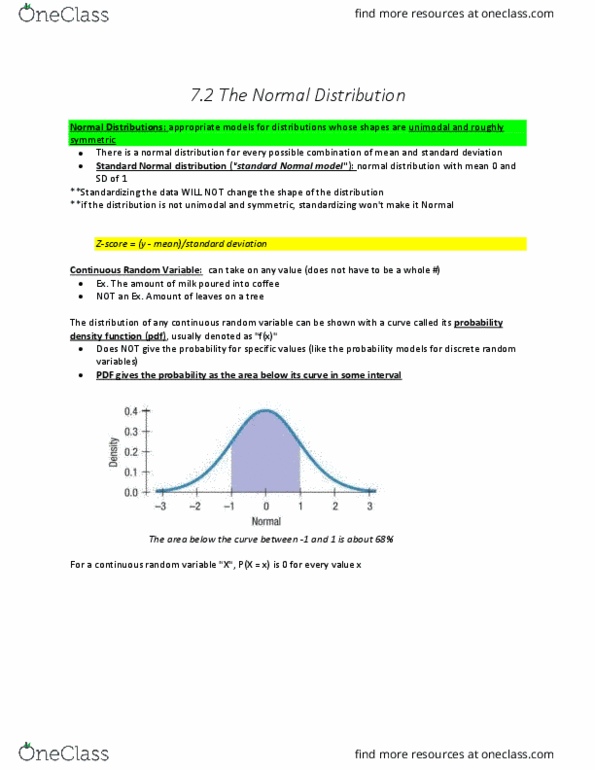
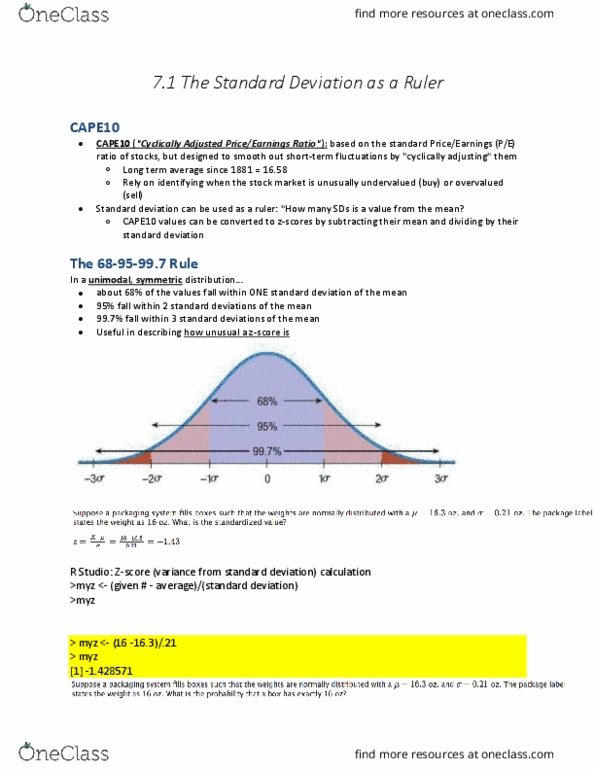
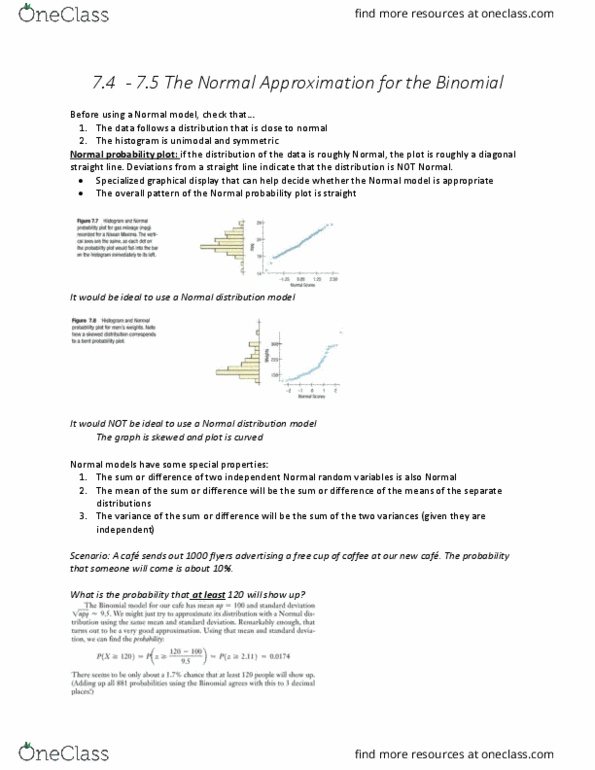
Chapter 7: the normal and other continuous distributions. 68: about 68% of values in a unimodal, symmetric distribution fall within 1 standard deviation of the mean. 95: about 95% of the values fall within 2 standard deviations of the mean. 99. 7: about 99. 7% of the values fall within 3 standard deviations of the mean. Normal distributions: models for distributions whose shapes are unimodal and roughly symmetric (bell-shaped curves) Standard normal distribution (standard normal model): normal distribution with mean 0 and standard deviation 1. The distribution of any continuous random variable can be shown with its probability density function (pdf) Normal probability plot: if the distribution of data is roughly normal, the plot is roughly a diagonal straight line. Mean of sum or difference is sum or difference of means of separate distributions. Variance of sum or difference is sum of two variances. Standard deviation of sum or difference is.