STA 309 Chapter 2: Chapter 2 Notes

Document Summary
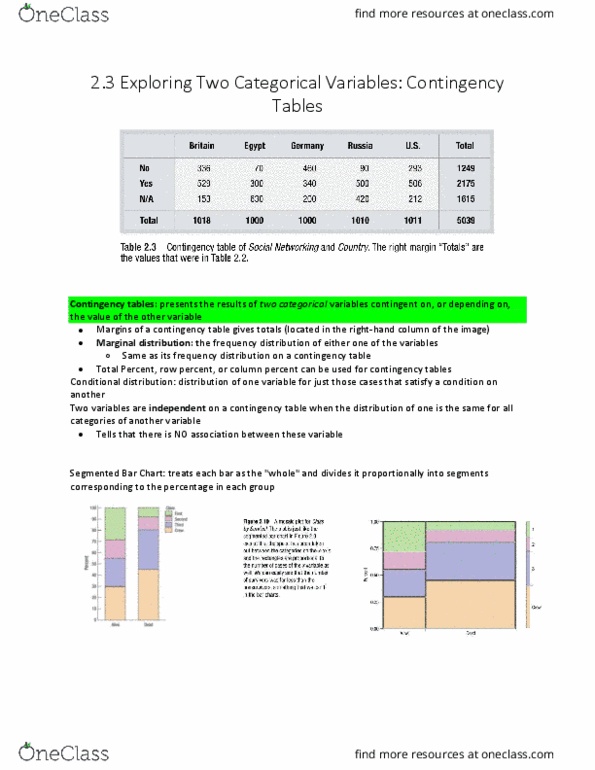
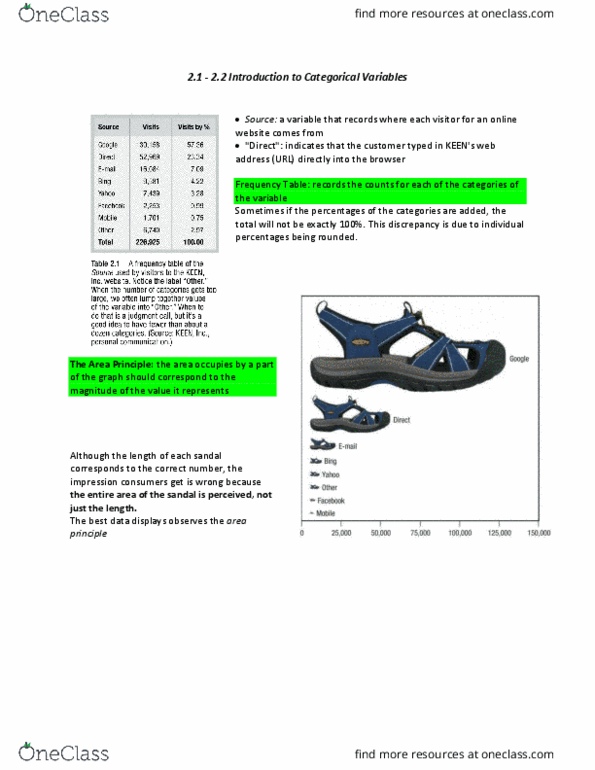
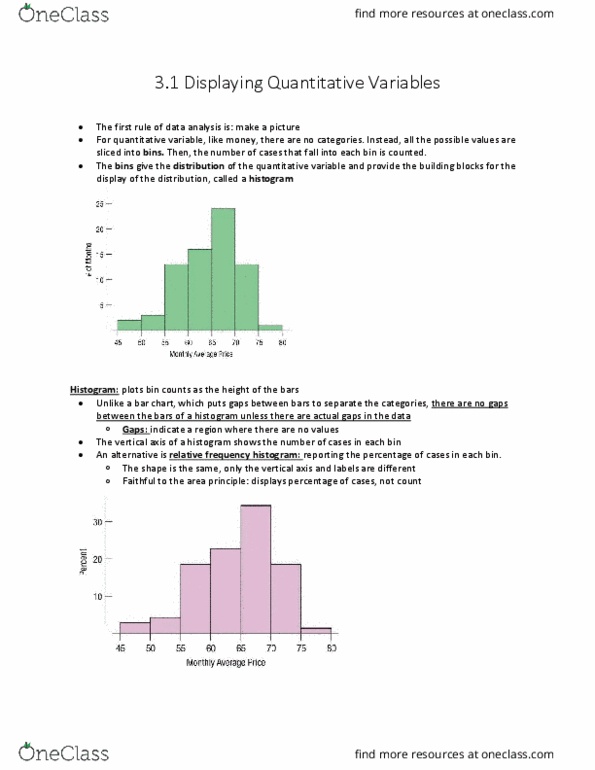
Frequency table: records the counts for each of the categories of the variable. Area principle: the area occupied by a part of the graph should correspond to the magnitude of the value it represents. Bar chart: displays the distribution of a categorical variable, showing the counts for each category next to each other for easy comparison. Relative frequency bar chart: draws attention to relative proportion; replace counts with percentages. Pie chart: shows how a whole group breaks into several categories. Contingency tables: shows how individuals are distributed along each variable depending on, or contingent on, the value of the other variable. The margins of a contingency table give totals. Marginal distribution: frequency distribution of either one of the variables at the margins of a contingency table. Cell: any intersection of a row and column of a table, giving a count for a combination of values of the two variables.