FIN 3200 Chapter Notes - Chapter 3: Asset Management, Valuation Using Multiples, Income Statement

Document Summary
Get access


Related Documents
Related Questions
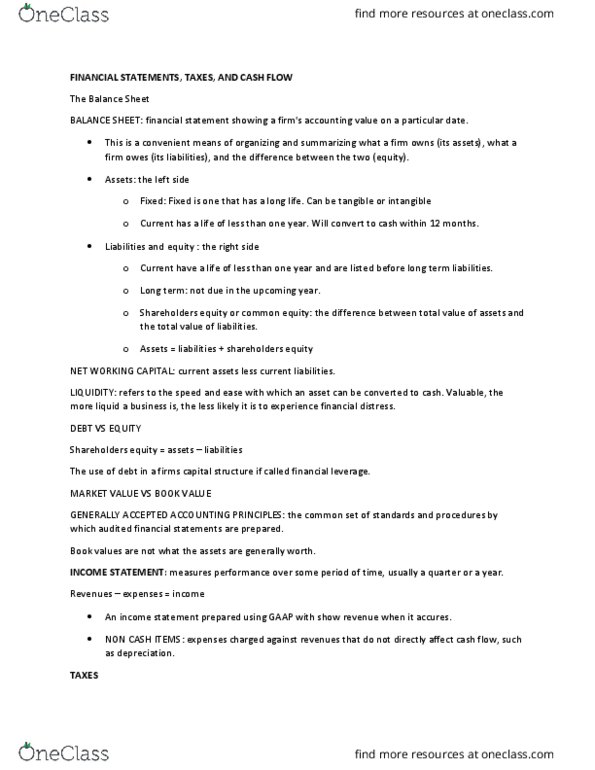
1. Discuss the importance of financial statements and how they are used by businesses.
2. What is the basic format of the income statement and what is the relevance of the basic categories?
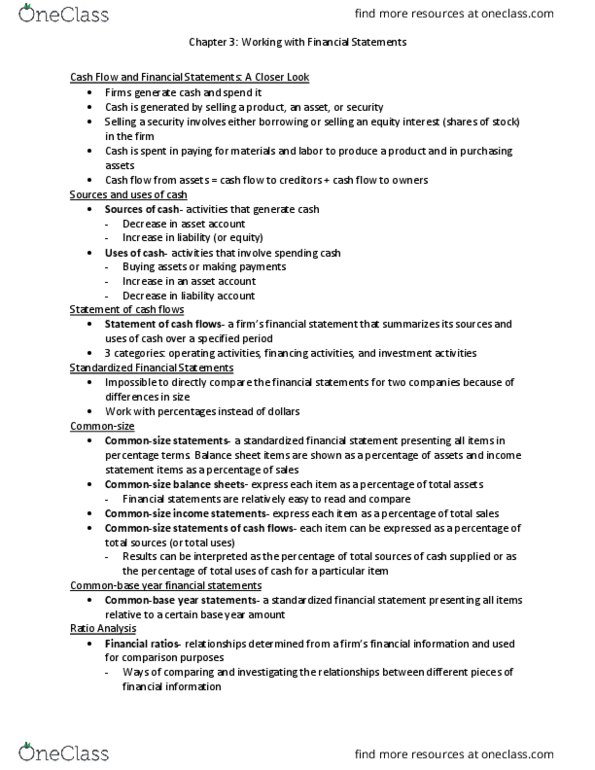
3. Cash flows for an organization come from operating activities and investment activities. Discuss the importance of each to the organization.
The Happy Auto Shop has the following annual information:
| Gross Sales | $700,000 |
| Net sales | $696,000 |
| Gross profit | $448,000 |
What are the shopâs returns and allowances and cost of goods sold?
Construct a statement of financial position (balance sheet) for the Humperdink family using the following information:
| cash | $50 |
| Checking account | $2,500 |
| student loan balance | $6,000 |
| stocks and bonds | $2,600 |
| savings account | $5,850 |
| residence | $110,000 |
| automobile | $12,000 |
| savings account | $5,800 |
| automobile loan balance | $12,000 |
| 401K retirement account | $15,000 |
| furniture, clothing, jewelry | $8,000 |
| credit card balance | $4,000 |
| mortgage loan balance | $99,000 |
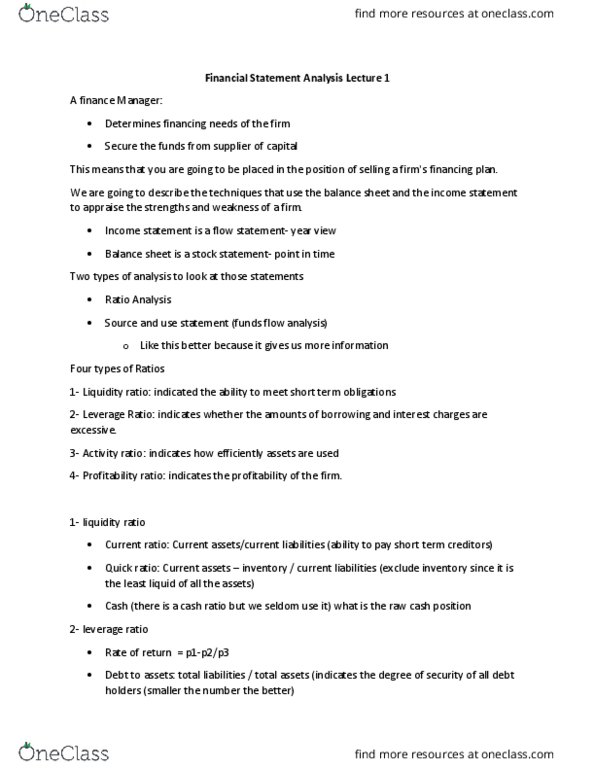
What is the purpose of financial statement analysis? How do the three types of financial statement analysis differ from each other and when is each used?
Samantha Knight is applying for a small-business loan. She provides the bank with the following information:
| cash in checking accounts | $5,000 |
| cash in savings | $10,350 |
| home market value | $145,500 |
| first mortgage on house | $25,000 |
| home equity loan limit | $70,000 |
| home equity loan | $10,000 |
| automobile market value | $19,000 |
| automobile loan outstanding | $15,000 |
| credit card debt | $1,500 |
Calculate the debt-to-asset ratio.
Calculate the debt-to-equity ratio.
What percentage of Samantha's assets is owned by others?
Given the profit loss (income statement) and balance sheet for Sam's Sandwich Delivery (Table 4-8, page 121 of your textbook), answer the following:
Calculate the following ratios: current, quick, accounts receivable turnover, fixed asset turnover.
Using the inventory figure on the balance sheet as average inventory, calculate the inventory turnover ratio.
Calculate the debt-to-equity ratio, debt-to-total asset ratio, and operating profit margin ratio.
Perform a vertical analysis of the income statement.
Perform a vertical analysis of the balance sheet.
Based on your analysis, would you consider investing in Sam's Sandwich Delivery?

Just need the last two questions answered A and B at the bottom of the document
Youâre the chief financial officer (CFO) of Worldwide
Widget Manufacturing, Inc. The company manufactures and
sells widgets at factories in the United States and internationally.
Listed below are partial financial statements for Worldwide
Widget Manufacturing, Inc. Fill in the missing information in
each of the following financial statements. Answer spaces are
given below.
Worldwide Widget Manufacturing, Inc.
Balance Sheet as of December 31, 2015 and 2014
(in millions of dollars)
| 2015 | 2016 | 2015 | 2016 | ||
| Assets Current Assets: | Liabilities and Equity Current Liabilities: | ||||
| Cash and markatable securities | $427 | $322 | Accured wages and taxes | $309 | $257 |
| Accounts Receivable | a.? | 259 | Accounts payable | 381 | b.? |
| Inventory | 815 | 797 | Notes Payable | $492 | $421 |
| Total | $1,542 | $1,378 | Total | $1,182 | $997 |
| Fixed Assets: | Long-term debt: | $1,934 | c.? | ||
| Gross plant and equipment | d.? | $2,817 | Total | 3,116 | 2,956 |
| Less:depreciation | 368 | 254 | Stockholder's equity: | ||
| Net plant and equipment | $2,872 | $2,563 | Preferred stock ( 30 million shares) | $30 | $30 |
| Other long term assets | 521 | 487 | Common stock and paid in surplus (250 million shares) | 300 | e.? |
| Retained earnings | 1,489 | 1,142 | |||
| Total FA | f.? | $3,050 | Total Equity | $1,819 | $1,472 |
| Total Assets | $4,935 | $4,428 | Total liabilities and equity | $4,935 | $4,428 |
A. Accounts receivable for 2015_______300
B. Accounts payable for 2014_______319
C. Gross plant and equipment for 2015_______1959
D. Long-term debt for 2014_______3240
E. Common stock and paid-in surplus (250 million shares) for 2014_______300
F. Total FA for 2015_______3393
Worldwide Widget Manufacturing, Inc. Income Statement for Years Ending December 31, 2015 and 2014(in millions of dollars)
| 2015 | 2014 | |
| Net Sales | g. | $2018 |
| Less: Cost of Goods Sold | 753 | h.? |
| Gross Profits | $1,623 | $1,189 |
| Less: Other Operating Expense | 423 | 167 |
| Earnings before interest, taxes, depreciation, and amortization (EBITDA) | $1,200 | $1,022 |
| Less: Depreciation | 114 | 114 |
| Earning before interest and taxes (EBIT) | $1,086 | $908 |
| Less: Interest | i.? | 128 |
| Earnings:before Taxes (EBT) | $949 | $780 |
| Less:Taxes | j.? | 23 |
| Net Income | $664 | $546 |
| Less:Preferred stock dividends | 98 | 98 |
| Net income available to common stock holders | $566 | $448 |
| Less:Common stock dividends | 219 | 199 |
| Addition to retained earnings Per common share data: | $347 | $249 |
| Earnings per share (EPS) | k.? | $1.79 |
| Dividends per share (DPS) | $0.88 | l. ? |
| Book Value per share (BVPS) | m.? | $5.77 |
| Market Value per share (MVPS) | $23.97 | $22.47 |
g. Net sales for 2015_______2376
h. Less: Cost of goods sold for 2014_______829
i. Less: Interest for 2015_______137
j. Less: Taxes for 2015_______285
k. Earnings per share (EPS) for 2015_______1.88
l. Dividends per share (DPS) for 2014_______.73
m. Book value per share (BVPS) for 2015_______7.16
Worldwide Widget Manufacturing, Inc.
Statement of Cash Flows for Year Ending December 31, 2015
(in millions of dollars)â
| Section A: Cash Flows from operating activities | |
| Net Income | n.? |
| Additions (source of cash): Depreciation | 114 |
| Increase in accrued wages and taxes | o.? |
| Increase in accounts payable | 62 |
| Subtractions (use of cash): Increase in accounts receivable | -41 |
| Increase in inventory | p.? |
| Net Cash flow from operating activities | q.? |
| Section B: Cash Flows from investing activities subtractions: Increase in fixed assets | -$343 |
| Increase in other long-term assests | r.? |
| Net Cash flow from investing activities | s.? |
| Section C. Cash flows from financing activities Additions: Increase in notes payable | t.? |
| Increase in common and preferred stock | 0 |
| Subtractions: Decrease in long-term debt | -25 |
| Pay dividends | u.? |
| Net Cash flow from financing activities Section D. Net Change in cash and marketable securities | v.? $105 |
n. Net income_______664
o. Increase in accrued wages and taxes_______52
p. Increase in inventory_______18
q. Net cash flow from operating activities_______833
r. Increase in other long-term assets_______34
s. Net cash flow from investing activities_______-377
t. Increase in notes payable_______71
u. Pay dividends_______317
v. Net cash flow from financing activities_______-271
Worldwide Widget Manufacturing, Inc.
Statement of Retained Earnings as of December 31, 2015
(in millions of dollars)
| Balance of retained earnings, December 31,2014 | $1,142 | |
| Plus: Net income for 2015 | w.? | |
| Less: Cash dividends paid | 0 | 0 |
| Preferred stock | x.? | |
| Common Stock | 219 | |
| Total cash dividends paid | 317 | |
| Balance of retained earnings, December 31,2015 | $1,489 |
w. Plus: Net income for 2015 _______664
x. Preferred stock _______98
2. Youâll need to compare your companyâs ratios with the industryâs standards.
Worldwide Widget Manufacturing, Inc.
| Company | Industy | Comparison | |
| Current Ratio | 2.2 times | ||
| Quick Ratio | 1.1 times | ||
| Cash Ratio | 0.35 times | ||
| Inventory turnover | 2 times or 1 time | ||
| Days' sales in inventory | 135 days or 335 days | ||
| Average payment period | 110 days | ||
| Sales to working capital | 3 times | ||
| Total asset turnover | 0.6 times | ||
| Debt-to equity | 1.1 times | ||
| Profit margin | 16.5% | ||
| Gross profit margin | 48.13% | ||
| ROA | 8.78% | ||
| ROE | 19.45% | ||
| Divident payout | 32% |
A. Use the information found in Worldwide Widget Manufacturingâs financial statements
to calculate all of the listed financial ratios in the above table for your
company. Then, for each ratio, provide a comparison of the companyâs result
with the industry standards, indicating if your companyâs results are lower than,
higher than, slower than, or faster than the industry standards.
B. Calculate your companyâs internal and sustainable growth rates.
