ECON 1201 Chapter Notes - Chapter 3: Technological Change, Economic Equilibrium, Demand Curve


74
ECON 1201 Full Course Notes
Verified Note
74 documents
Document Summary
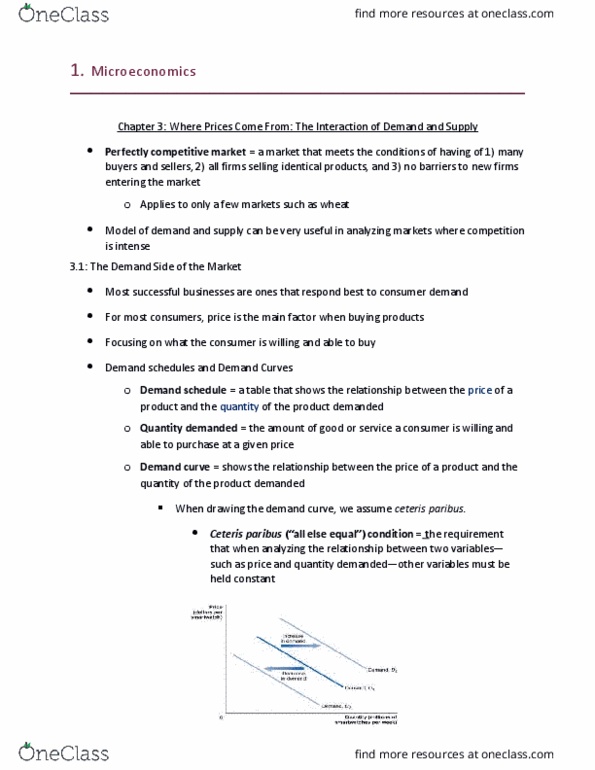
Demand schedule: a table that shows the relationship between the price of a product and. Quantity demanded: t he amount of a good or service that a consumer is willing and able. Demand curve: a curve that shows the relationship between the price of a product and the. Market demand : the demand by all the consumers of a given good or service. Buyers demand a larger quantity of a product as the price falls because the product quantity of the product demanded becomes less expensive relative to other products and because they can afford to buy more at a lower. When the price of a product falls, consumers buy a larger quantity because of 2 quantities: The substitution effect: refers to the change in quantity demanded of a good that results because a change in price makes the good more or less expensive relative to other goods that are substitutes.