STATS 10 Chapter Notes - Chapter 4: Dependent And Independent Variables, Scatter Plot

Document Summary
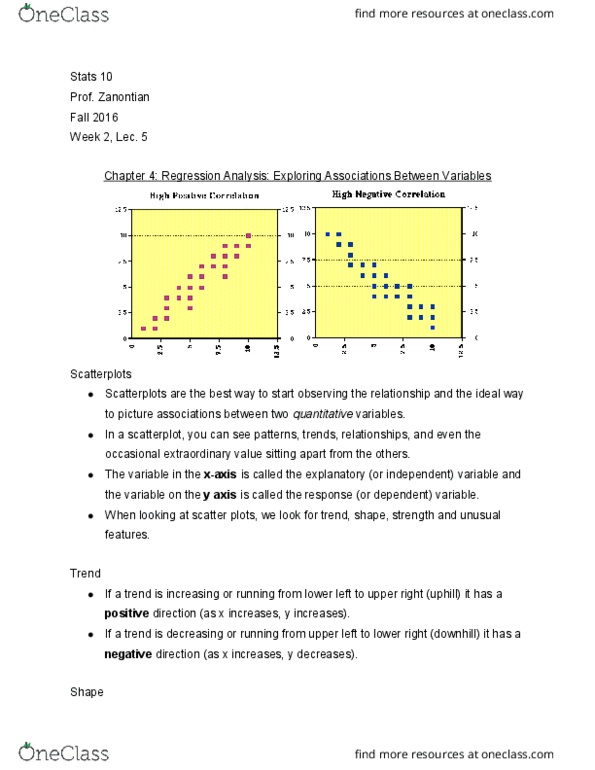
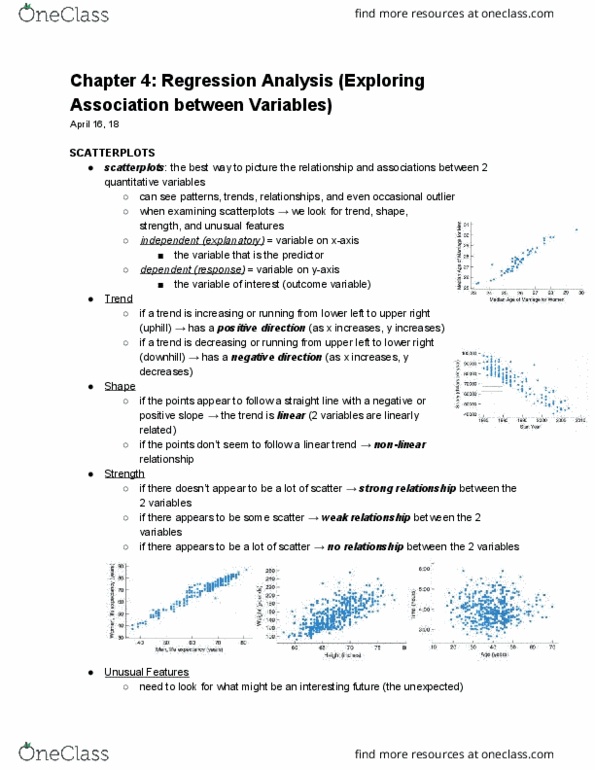
Chapter 4 regression analysis: exploring associations between variables. Regression used to analyze associations/relationships between two numerical variables. Primary tool for examining 2 numerical variable relationships. A point in a scatterplot = an observation with two variables (x and y) Look for: trend (which is like center, strength (which is like spread, shape (which is like, well, shape) Trend of an association = general tendency of the scatterplot from left to right. Weak = large amount of scatter in scatterplot. Outliers / exceptions / observations that do not fit (and maybe reason) Correlation coefficient = number that measures strength of the linear association between 2 numerical variables. If r is close to either -1 or +1 = very strong association. If r is close to 0 = weak association. If r is + = trend is + If r is - = trend is . Correlation coefficient does not tell us about individual students.