ACC 113 Chapter Notes - Chapter 1: Income Statement, Variable Cost, Financial Statement
38 views2 pages

5 Jan 2021
School
Department
Course
Professor
Document Summary
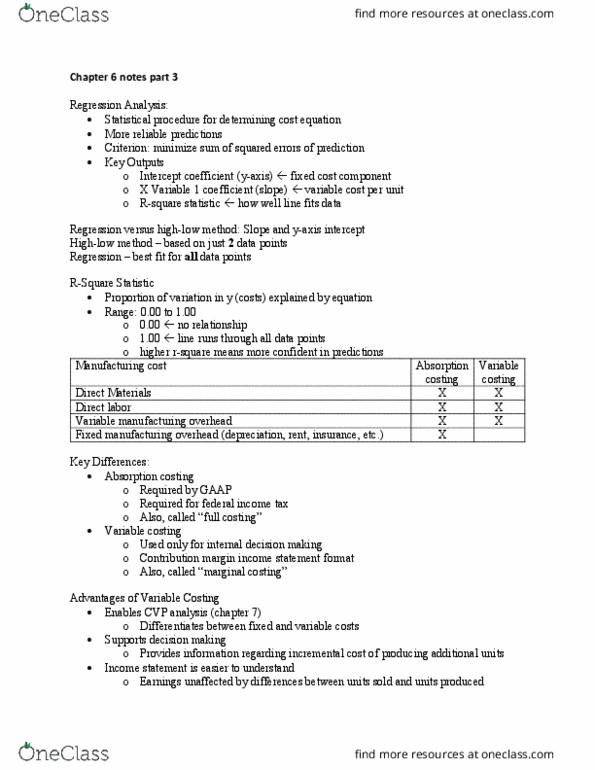
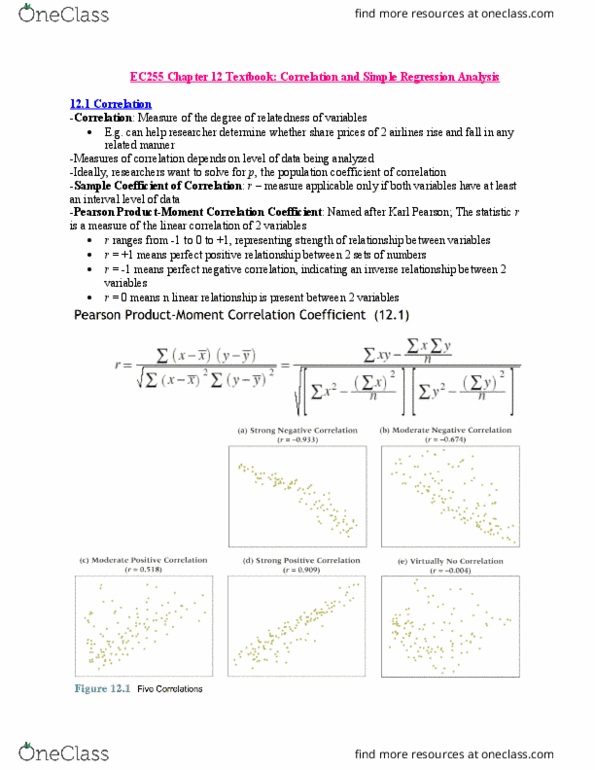
Procedure that uses statistical methods (least squares regression) to fit a cost line (regression line) through a number of data points. Data points do not have to lie along straight line as the procedure finds line that minimises sum of the squared distances from each data point. Multiple r (correlation coefficient) measures proximity of data points to regression line and sign of statistic (+ or -) tells direction of correlation which is positive for ape. R square (r2) called coefficient of determination measure or goodness of fit. R2 of 1. 0 indicates perfect correlation between independent and dependent variables. Outliers can also result in low r2 values. Uses two data points (related to high and low levels of activity) and derives an equation for a straight line. Forces a line between the two points and disregards other points. Impact of income taxes on costs and decision making.
Get access
Grade+20% off
$8 USD/m$10 USD/m
Billed $96 USD annually

Homework Help
Study Guides
Textbook Solutions
Class Notes
Textbook Notes
Booster Class
40 Verified Answers
Class+
$8 USD/m
Billed $96 USD annually

Homework Help
Study Guides
Textbook Solutions
Class Notes
Textbook Notes
Booster Class
30 Verified Answers