STAT 119 Chapter Notes - Chapter 4: Scatter Plot, Categorical Variable, Dependent And Independent Variables

Document Summary
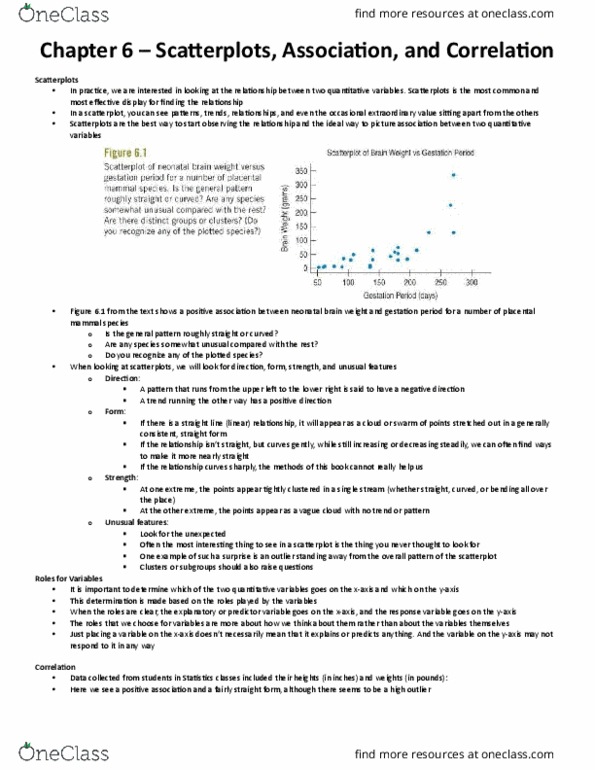
You can see patterns, trends, relationships, and the occasional unusual cases standing apart from the general pattern. Best way to start observing the relationship between two quantitative variables. Negative - pattern that runs from the upper left to the lower right. Positive - pattern that runs from the bottom left to the upper right. If there is a straight line relationship, it will appear as a cloud of points stretched out in a general consistent, straight form. Some points may appear tightly clustered or spread out that there is barely a pattern. Outlier - standing away from the overall pattern of the scatterplot. Each has units and should appear with the display. Correlation - measures the strength of the linear association between two quantitative variables. Quantitative variable condition - correlation applies only to quantitative variables. Don"t apply correlation to categorical data masquerading as quantitative.