FINA 2201 Chapter Notes - Chapter 4: Inventory Turnover, Asset Turnover, Quick Ratio
21 views7 pages

27 Jan 2016
School
Department
Course
Professor
Document Summary
It is important to analyze trends in ratios as well as their absolute levels, for trends give clues as to whether a firm"s financial condition is likely to improve or to deteriorate: trend analysis, simply plot a ratio over time ratio analysis is used by three main groups: (1) managers, who use ratios to help analyze, control, and thus improve their firms" operations; (2) credit analysts, including bank loan officers and bond rating analysts, who analyze ratios to help judge a company"s ability to repay its debts (3) stock analysts, who are interested in a company"s efficiency, risk, and growth prospects. Dupont analysis: with this method, assets are measured at their gross book value(original (historical) price paid for an asset, without any depreciation deduction. )rather than at net book value in order to produce a higher return on equity (roe).
Get access
Grade+20% off
$8 USD/m$10 USD/m
Billed $96 USD annually

Homework Help
Study Guides
Textbook Solutions
Class Notes
Textbook Notes
Booster Class
40 Verified Answers
Class+
$8 USD/m
Billed $96 USD annually

Homework Help
Study Guides
Textbook Solutions
Class Notes
Textbook Notes
Booster Class
30 Verified Answers
Related Documents
Related Questions

| Joshua & White Technologies: December 31 Balance Sheets | ||||||
| (Thousands of Dollars) | ||||||
| Assets | 2010 | 2009 | ||||
| Cash and cash equivalents | $21,000 | $20,000 | ||||
| Short-term investments | 3,759 | 3,240 | ||||
| Accounts Receivable | 52,500 | 48,000 | ||||
| Inventories | 84,000 | 56,000 | ||||
| Total current assets | $161,259 | $127,240 | ||||
| Net fixed assets | 218,400 | 200,000 | ||||
| Total assets | $379,659 | $327,240 | ||||
| Liabilities and equity | ||||||
| Accounts payable | $33,600 | $32,000 | ||||
| Accruals | 12,600 | 12,000 | ||||
| Notes payable | 19,929 | 6,480 | ||||
| Total current liabilities | $66,129 | $50,480 | ||||
| Long-term debt | 67,662 | 58,320 | ||||
| Total liabilities | $133,791 | $108,800 | ||||
| Common stock | 183,793 | 178,440 | ||||
| Retained Earnings | 62,075 | 40,000 | ||||
| Total common equity | $245,868 | $218,440 | ||||
| Total liabilities and equity | $379,659 | $327,240 | ||||
| Joshua & White Technologies December 31 Income Statements | ||||||
| (Thousands of Dollars) | ||||||
| 2010 | 2009 | |||||
| Sales | $420,000 | $400,000 | ||||
| Expenses excluding depr. and amort. | 327,600 | 320,000 | ||||
| EBITDA | $92,400 | $80,000 | ||||
| Depreciation and Amortization | 19,660 | 18,000 | ||||
| EBIT | $72,740 | $62,000 | ||||
| Interest Expense | 5,740 | 4,460 | ||||
| EBT | $67,000 | $57,540 | ||||
| Taxes (40%) | 26,800 | 23,016 | ||||
| Net Income | $40,200 | $34,524 | ||||
| Common dividends | $18,125 | $17,262 | ||||
| Addition to retained earnings | $22,075 | $17,262 | ||||
| Other Data | 2010 | 2009 | ||||
| Year-end Stock Price | $90.00 | $96.00 | ||||
| # of shares (Thousands) | 4,052 | 4,000 | ||||
| Lease payment (Thousands of Dollars) | $20,000 | $20,000 | ||||
| Sinking fund payment (Thousands of Dollars) | $0 | $0 | ||||
| Ratio Analysis | 2010 | 2009 | Industry Avg | |||
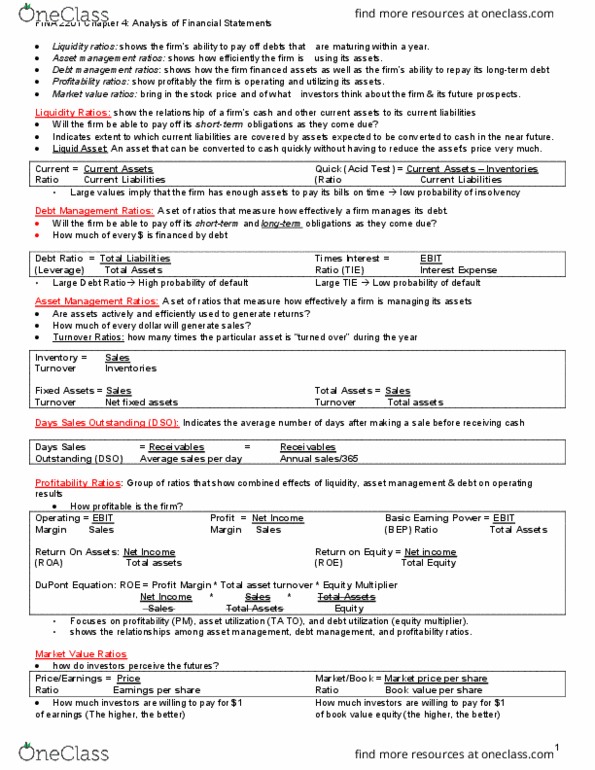
| Liquidity Ratios | ||||||
| Current Ratio | 2.38 | 2.52 | 2.58 | |||
| Quick Ratio | 1.17 | 1.41 | 1.53 | |||
| Asset Management Ratios | ||||||
| Inventory Turnover | 1.11 | 1.22 | 7.69 | |||
| Days Sales Outstanding | 45.63 | 43.80 | 47.45 | |||
| Fixed Assets Turnover | 1.92 | 2.00 | 2.04 | |||
| Total Assets Turnover | 3.81 | 5.64 | 1.23 | |||
| Debt Management Ratios | ||||||
| Debt Ratio | 32.1% | |||||
| Times-interest-earned ratio | 15.33 | |||||
| EBITDA coverage ratio | 4.18 | |||||
| Profitability Ratios | ||||||
| Profit Margin | 9.57% | 8.63% | 8.86% | |||
| Basic Earning Power | 19.16% | 18.95% | 19.48% | |||
| Return on Assets | 10.59% | 10.55% | 10.93% | |||
| Return on Equity | 21.87% | 19.35% | 16.10% | |||
| Market Value Ratios | ||||||
| Earnings per share | NA | |||||
| Price-to-earnings ratio | 10.65 | |||||
| Cash flow per share | NA | |||||
| Price-to-cash flow ratio | 7.11 | |||||
| Book Value per share | NA | |||||
| Market-to-book ratio | 1.72 | |||||
| a. Has Joshua & White's liquidity position improved or worsened? Explain. | ||||||
| The position of JW has worsend because there ration has fallen from 1.41 to 1.17 | ||||||
| b. Has Joshua & White's ability to manage its assets improved or worsened? Explain. | ||||||
| c. How has Joshua & White's profitability changed during the last year? | ||||||
| d. Perform an extended Du Pont analysis for Joshua & White for 2008 and 2009. | ||||||
| ROE = | PM x | TA Turnover x Equity Multiplier | ||||
| 2010 | ||||||
| 2009 | ||||||
| e. Perform a common size analysis. What has happened to the composition | ||||||
| (that is, percentage in each category) of assets and liabilities? | ||||||
| Common Size Balance Sheets | ||||||
| Assets | 2010 | 2009 | ||||
| Cash and cash equivalents | ||||||
| Short-term investments | ||||||
| Accounts Receivable | ||||||
| Inventories | ||||||
| Total current assets | ||||||
| Net fixed assets | ||||||
| Total assets | ||||||
| Liabilities and equity | 2010 | 2009 | ||||
| Accounts payable | ||||||
| Accruals | ||||||
| Notes payable | ||||||
| Total current liabilities | ||||||
| Long-term debt | ||||||
| Total liabilities | ||||||
| Common stock | ||||||
| Retained Earnings | ||||||
| Total common equity | ||||||
| Total liabilities and equity | ||||||
| Common Size Income Statements | 2010 | 2009 | ||||
| Sales | ||||||
| Expenses excluding depr. and amort. | ||||||
| EBITDA | ||||||
| Depreciation and Amortization | ||||||
| EBIT | ||||||
| Interest Expense | ||||||
| EBT | ||||||
| Taxes (40%) | ||||||
| Net Income | ||||||
| f. Perform a percent change analysis. What does this tell you about the change in profitability | ||||||
| and asset utilization? | ||||||
| Percent Change Balance Sheets | Base | |||||
| Assets | 2010 | 2009 | ||||
| Cash and cash equivalents | ||||||
| Short-term investments | ||||||
| Accounts Receivable | ||||||
| Inventories | ||||||
| Total current assets | ||||||
| Net fixed assets | ||||||
| Total assets | ||||||
| Base | ||||||
| Liabilities and equity | 2010 | 2009 | ||||
| Accounts payable | ||||||
| Accruals | ||||||
| Notes payable | ||||||
| Total current liabilities | ||||||
| Long-term debt | ||||||
| Total liabilities | ||||||
| Common stock | ||||||
| Retained Earnings | ||||||
| Total common equity | ||||||
| Total liabilities and equity | ||||||
| Base | ||||||
| Percent Change Income Statements | 2010 | 2009 | ||||
| Sales | ||||||
| Expenses excluding depr. and amort. | ||||||
| EBITDA | ||||||
| Depreciation and Amortization | ||||||
| EBIT | ||||||
| Interest Expense | ||||||
| EBT | ||||||
| Taxes (40%) | ||||||
| Net Income | ||||||
