ACC 336 Chapter Notes - Chapter 3: Learning Curve, Variable Cost, Scatter Plot

10 Jun 2020
School
Department
Course
Professor
Document Summary
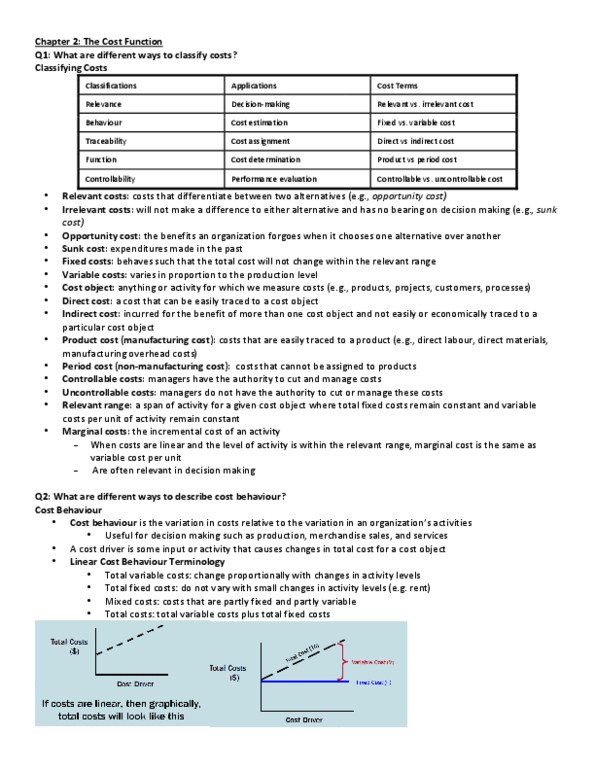
Y represents the tc which is dependent on x. F - xed cost component (intercept parameter) V - variable cost per unit (slope) X - measure of output (independent variable) For the high-low method we look at the volume of the activity. High/low could be outliers in the data set. Other pairs of points may be more representative. Allows for visual inspection of the data. Identi es nonlinear, outliers, and shifts in the cost relations. Lacks objective criterion for choosing the best- tting line. Deviation: di between the predicted and actual costs. Shown by the distance from the points marked in the scatter as the line of best t. The smaller the number, the better the t of the line. Input y range is the dependent variables - cost. Input x range is the independent variables -measure of output (independent variable) Check yourself using the # of observations. Rsquared shows how much the driver is generating the cost.