ECON 2010 Chapter Notes - Chapter 4: Demand Curve, Mercedes-Benz 130


46
ECON 2010 Full Course Notes
Verified Note
46 documents
Document Summary
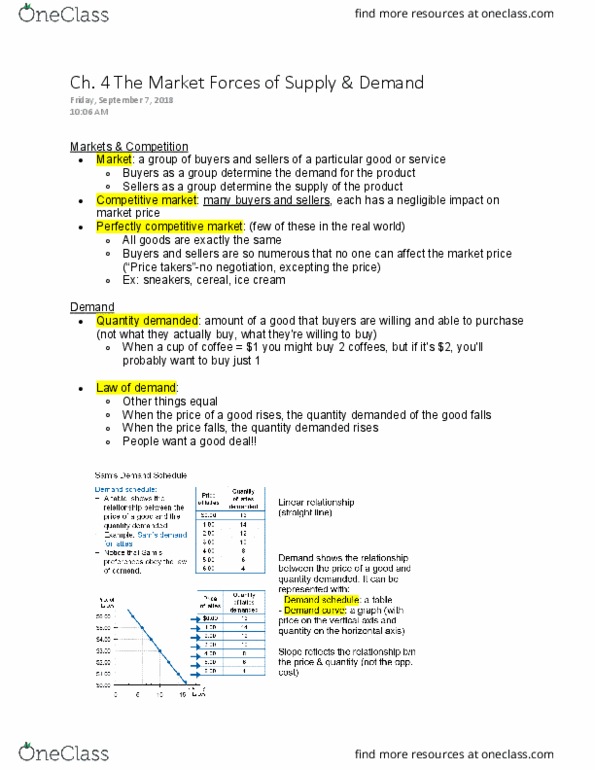
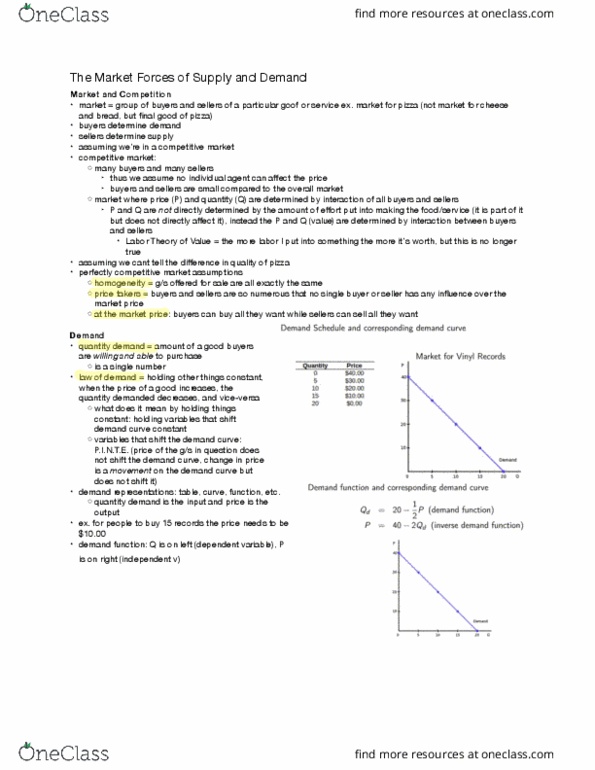
The following is a demand schedule of an ice-cream cone: a demand curve is the visual representation through a graph of the relationship between the price of a good and the quantity demanded. The market demand for ice-cream cones: an increase in demand results in a shift to the right of a demand curve, a decrease in demand results in a shift to the left of a demand curve. Increase or decrease of demand occurs when a determinant of demand other than price changes: Changes in tastes and fashion can alter the demand of a good or service. Changes in expectations of the future can alter the demand of a good or. The supply schedule of ice-cream cones: a supply curve is a visual representation through a graph of the relationship between the price of a good and the quantity supplied.