PSYC 2530 Chapter Notes - Chapter 2: Bar Chart, Frequency Distribution, Percentile Rank

19 Nov 2012
School
Department
Course
Professor
Document Summary
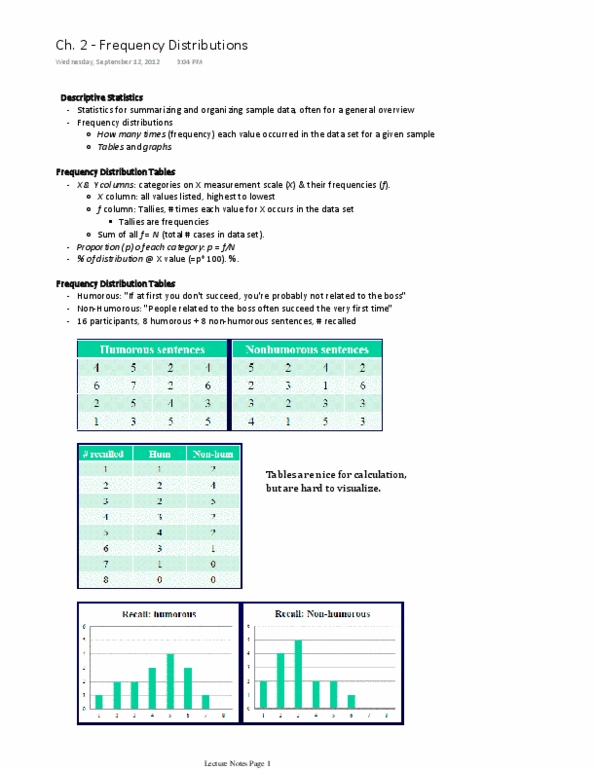
F = n f = column heading for frequencies: fraction of the total group that is associated with each score, commonly a decimal. Graphs: x-axis = x values, y-axis = frequencies. Constructing a histogram: the height of the bar corresponds to the frequency for that category, for continuous variables, the width of the bar extends to the real limits of the category. For discrete variables, each bar extends exactly half the distance to the adjacent category on each side: adjacent bars touch and there are no spaces or gaps between bars. Modified histogram: draw a stack of blocks above each score, equal to the frequency, eliminates the need for a y-axis. Bar graph: a bar graph is essentially the same as a histogram, except that spaces are left between adjacent bars. Negatively skewed: tail points to the left. Positively skewed: tail points to the right.