EC255 Chapter Notes - Chapter 3: Percentile, Central Tendency, Level Of Measurement


3.1 Measure of Central Tendency: Ungrouped Data
• Measure of central tendency: yields information about the centre, or middle part, of a group of
numbers
• One type to measure used to describe a set of data
• Mean, median, mode, percentiles, quartiles
Mean
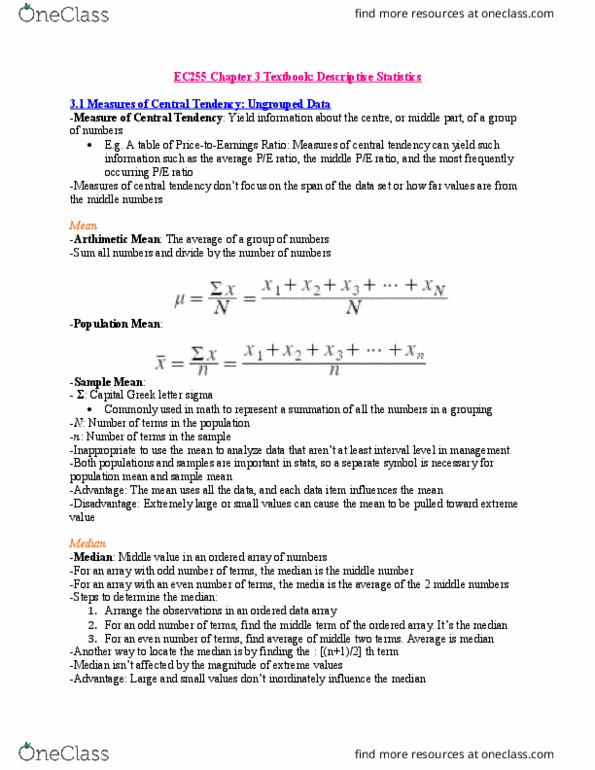
• Arithmetic mean: the average of a group of numbers
• Compute by summing all numbers and dividing the number of numbers
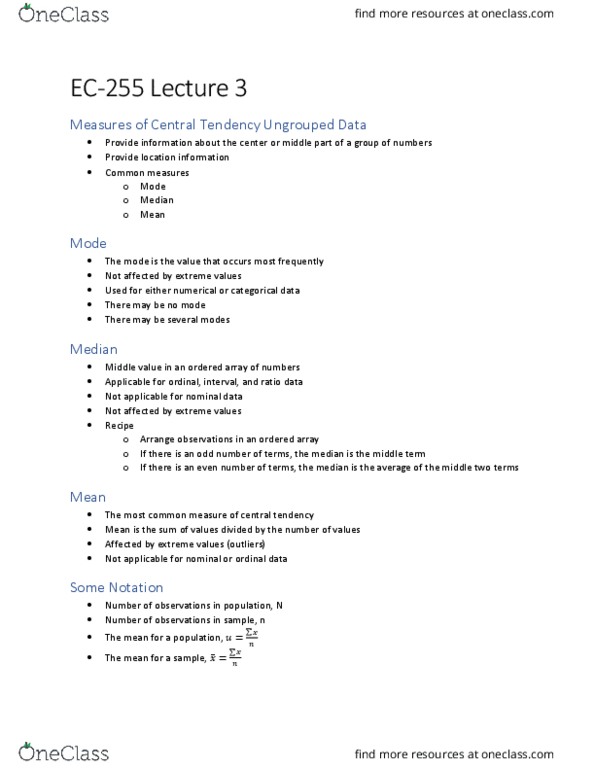
• Population mean = µ
• Sample mean = x
• Σ represets a suatio of all the ubers i a groupig
• N is the number of terms in the population
• n is the number of terms in the sample
• Data must be at least interval level
Median
• Median: the middle value in an ordered array of numbers
• For an array with an odd number of terms, median = middle number
• For an array with an even number of terms, median = average of the two middle numbers
• First step is to order the numbers in an array
• One way to locate is by finding the [(n +1)/2]th term
o Helpful when large # of terms
• Unaffected by magnitude of extreme values = advantage
• Best measure in analysis of variables like house costs, income, age, etc.
• Disadvantage = does not use all info
• Data must be at least ordinal
Mode
• Mode: the most frequently occurring value in a set of data
• Organizing data into an ordered array is helpful
• Data is bimodal when there is a tie for the most occurring value—two modes are listed
• Data is multimodal when data is not exactly bimodal but contains two values that are more
dominant than others—more than two modes
• In business, mode is often used in determining sizes
• Appropriate for nominal data
find more resources at oneclass.com
find more resources at oneclass.com

Percentiles
• Percentiles: measures of central tendency that divide a group of data into 100 parts
• There are 99 percentiles bc it takes 99 dividers to separate a group of data into 100 parts
• nth percentile : at least n percent of the data are below that value and at most (100 – n) percent
are above it
o 87th percentile is a value such that 87% of the data are below the value and no more
than 13% are above the value
• Are "stair-step" values
o E.g. if in safety eval 87.6% of the exam scores are below your score, you will still score at
only the 87th percentile even though 87% of scores are lower
Steps in Determining the Location of a Percentile
1. Organize numbers into an ascending-order array
2. Calculate the percentile location (i) by:
i = P/100 (n)
Where
P = the percentile of interest
i = percentile location
n = number in the data set
3. Determine the location by either (a) or (b)
a. If it's a whole #, the Pth percentile is the average of the value at the ith location and the
value at the (I + 1)th location
b. It not a whole #, the Pth percentile value is located at the whole number part of i + 1
Quartiles
• Quartiles: measures of central tendency that divide a group of data into four subgroups/parts
• The three quartiles are denoted as Q1, Q2, Q3
• Q1 separates the first (lowest) one fourth of the data from the upper three fourths and is equal
to the 25th percentile
• Q2 separates the second fourth of the data from the third fourth
o Located at the 50th percentile and equals the median
• Q3 divides the first three fourths of the data from the last fourth
o Equals the value of the 75th percentile
find more resources at oneclass.com
find more resources at oneclass.com

3.2 Measures of Variability: Ungrouped Data
• Measures of variability describe the spread or the dispersion of a set of data
• Necessary to complement the mean value in describing the data
Range
• Range: the difference between the largest value of a data set and the smallest value of the set
• Usually a single numeric value, but sometimes the ordered pair of smallest and largest numbers
(smallest, largest)
• Range = Highest – Lowest
Mean Absolute Deviation, Variance, and Standard Deviation
• Data must be at least interval level
• Suppose a company started production line building computers and in first five weeks, output
was 5, 9, 16, 17, 18 computers respectively.
o To summarize, compute as a mean:
o What is the variability of those 5 weeks of data?
o Subtract mean from each data value
• Deviation from the mean: subtracting the mean from each data value (x – µ)
find more resources at oneclass.com
find more resources at oneclass.com