Statistical Sciences 2244A/B Chapter Notes - Chapter 4: Dependent And Independent Variables, Standard Deviation, Scatter Plot

22 May 2018
School
Department
Professor

Stats 2244
Chapter 4
CHAPTER 4.1
The least-squares regression line
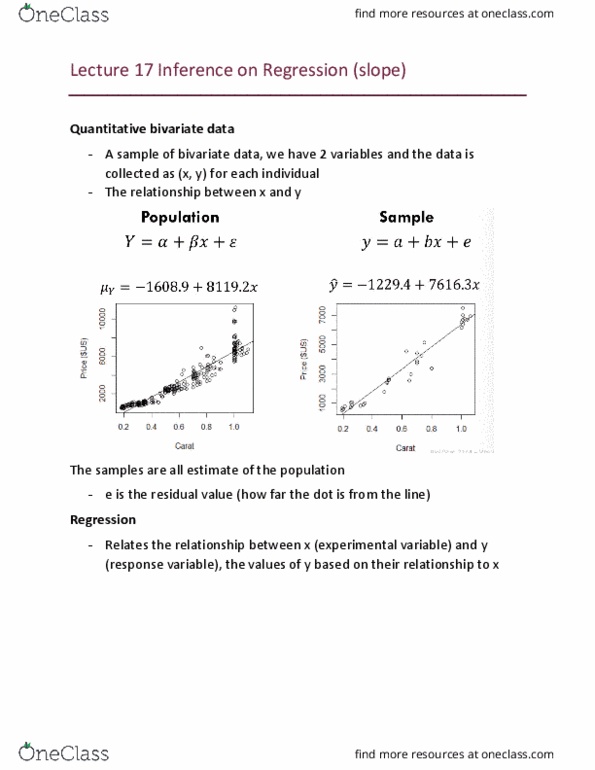
- A regression line is a straight line that summarizes the relationship between two variables, but
only in a specific setting: when one of the variables is thought to help explain or predict the
other
- That is, regression describes a relationship between an explanatory variable (x) and a response
variable (y). regression line
- We often use a regression line to predict the value of y for a given value of x.
- Review of straight lines:
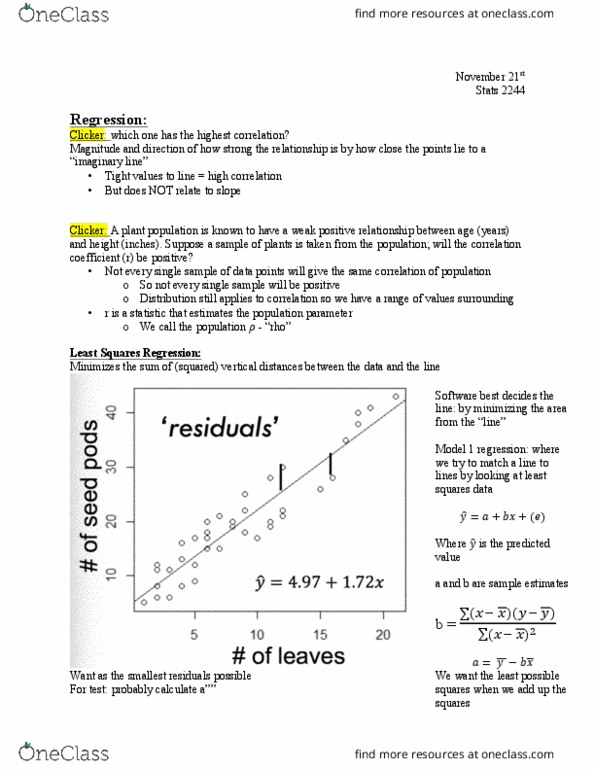
- A good regression line makes the vertical distances of the points from the line as small as
possible (most common way to do this is the least squares method)
- Least squares regression line:
o The least squares regression line of y on x is the line that makes the sum of the squares
of the vertical distances of the data points from the line as small as possible
- Equation of the least squares regression line:
o We have data on an explanatory variable x and a response variable y for n individuals
o From the data, calculate the means and and the standard deviations sx and sy of the
two variables and their correlation r
o The least-squares regression line is the line
o with slope
o and intercept
o its y hat in the equation of the regression line to make sure we understand that the line
gives a PREDICTED response, y hat for any x
CHAPTER 4.3
Facts about least squares regression
1. The distinction between explanatory and response variable is essential in regression
o Least-squares regression makes the distances of the data points from the line small only
in the y direction
o If we reverse the roles of the two variables, we get a different least-squares regression
line.
2. There is a close connection between correlation and the slope of the least-squares line. The
slope is
3. You see that the slope and the correlation always have the same sign
o For example, if a scatterplot shows a positive association, then both b and r are positive
o The formula for the slope b says more: along the regression line, a change of
one standard deviation in x corresponds to a change of r standard deviations in y.
o When the variables are perfectly correlated (r = 1 or r = −), the change in the predicted
response is the same (in standard deviation units) as the change in x.
find more resources at oneclass.com
find more resources at oneclass.com