Statistical Sciences 1024A/B Chapter Notes - Chapter 6: Dependent And Independent Variables, Scatter Plot

2 Feb 2017
School
Department
Professor

Document Summary
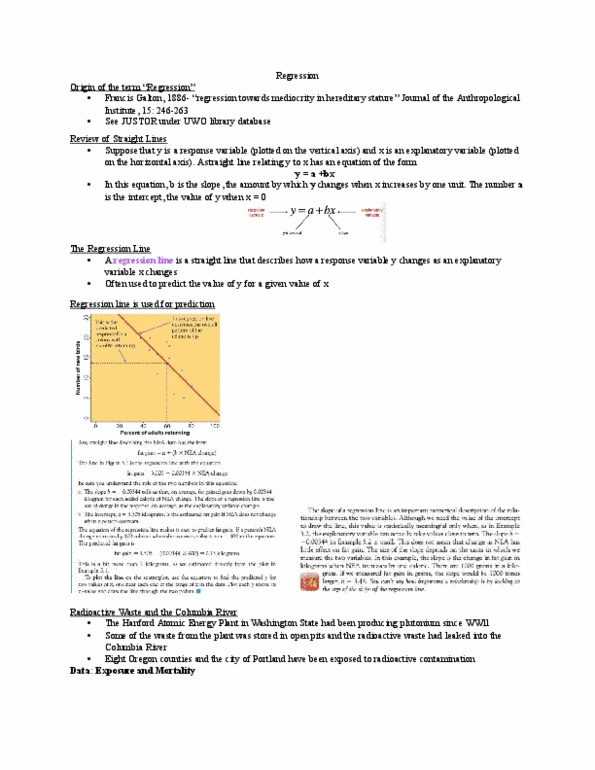
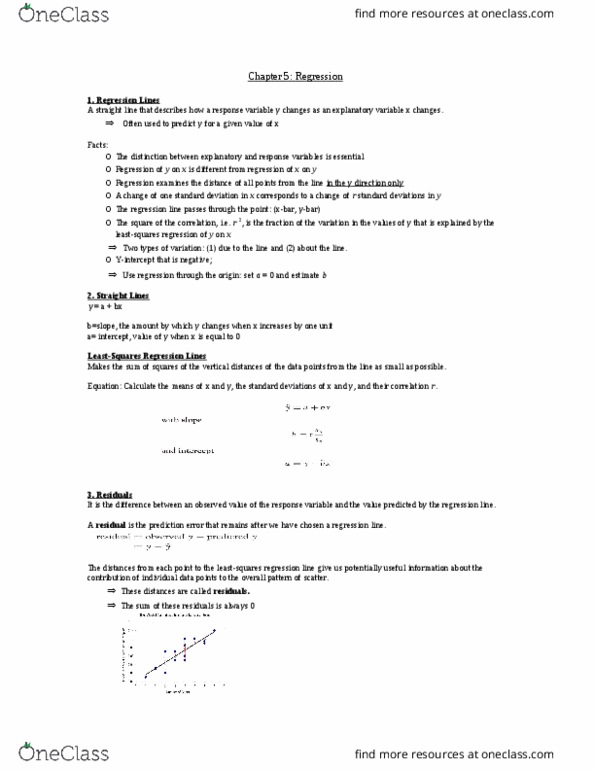
Distinction b/t explanatory & response variables is essential. Regression of y on x is different from regression of x on y. Slope b and correlation r always have same sign. Change in of one in sd in x corresponds to change of r sd in y. As correlation gets weaker, prediction y moves less in response to changes in x. Regression line passes through point (x,y) = (4. 62, 157. 3) Square of correlation r^2 is fraction of the variation in the values of y thats explained by the least-squares regression of y on x. 2 types of variation: variation that can be explained by least-squares regression line & variation that cannot. Residuals: difference b/t observed value of response variable and the value predicted by the regression line. Residual plots: scatterplot of the regression residuals against the explanatory variable x. Used to help assess the t of regression line. Examining residual plots: apply general principles of examining scatterplots by looking for: