Psychology 1000 Chapter Notes - Chapter Appendix: Statistical Significance, Statistical Inference, Null Hypothesis

24 Apr 2016
School
Department
Course
Professor


111
PSYCH 1000 Full Course Notes
Verified Note
111 documents
Document Summary
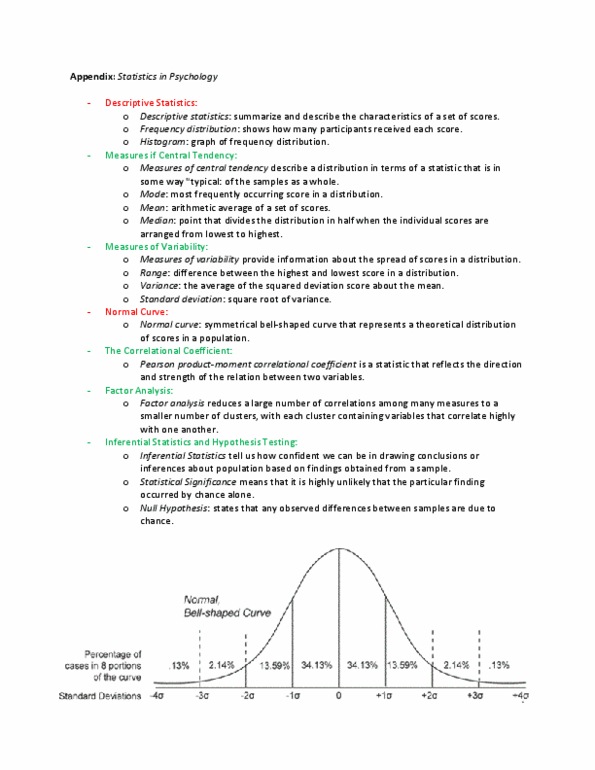
Descriptive statistics- summarize and describe characteristics of a set of scores. Frequency distribution- shows how many participants received each score. Data converted to histogram- graph of frequency distribution. Measures of central tendency- describe a distribution in terms of a single statistic that is in some way. Commonly used measures of central tendency: mode- score that occurs most often, mean- arithmetic average- m= x/n, median- point above and below which there is an equal number of scores. Normal curve- symmetrical bell-shaped curve- represents theoretical distribution of scores in population. 50% of cases fall on each side of mean- frequency of each score steadily decreases as you move away from the mean. Standard deviation can be used to divide normal curve into areas containing known percentages of population. Normal curve allows us to estimate probability that a given event will occur. Psychologists seek to explain and predict behaviour by examining how variables are related to one another.