Biology 2244A/B Chapter Notes - Chapter 9: Multivariate Normal Distribution, Confounding, Scatter Plot

15 Mar 2015
School
Department
Course
Professor

Document Summary
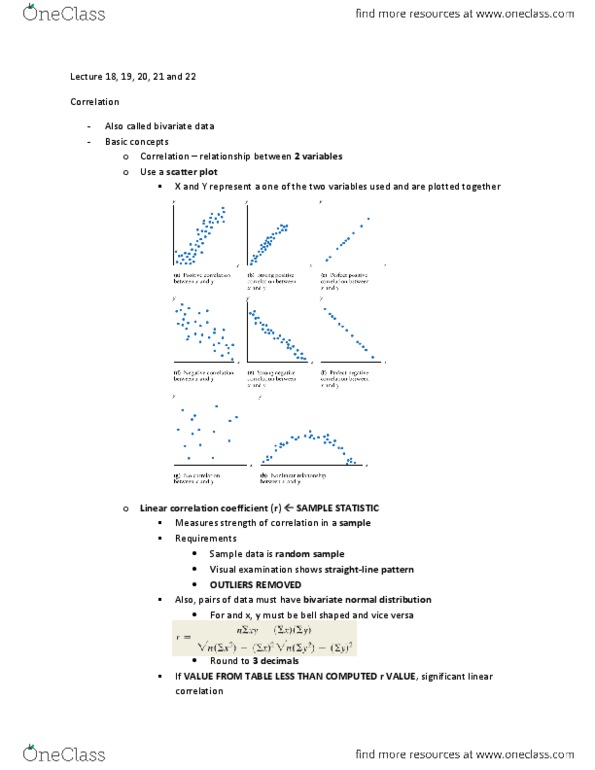
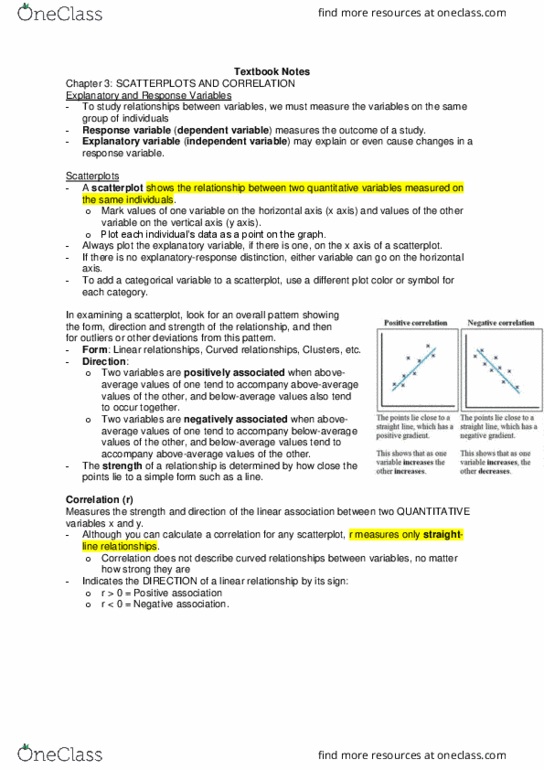
Correlation: exists between two variables when one of them is related to the other in some way. Check for trends: if one variable increases does the other seem to increase, observe if there are any outliers. Referred to as pearson product moment correlation coefficient. Measures strength of linear association between paired x- & y-quantitative values. Value is computed using formula and data. Sample values for x and y - sample statistic r. Population values for x and y population parameter - . Requires that for any fixed value of x corresponding values of y have a distribution that is bell-shaped. Requires that for any fixed values of y corresponding values of x have a distribution that is bell-shaped. Correlation does not mean causation: another variable could influence result (lurking variable) Association vs. causation many observational studies are done in different places: Higher doses are associated with stronger responses. Alleged cause precedes the effect in time.