STAB22H3 Chapter Notes - Chapter 3: Quartile, Interquartile Range, Standard Deviation


38
STAB22H3 Full Course Notes
Verified Note
38 documents
Document Summary
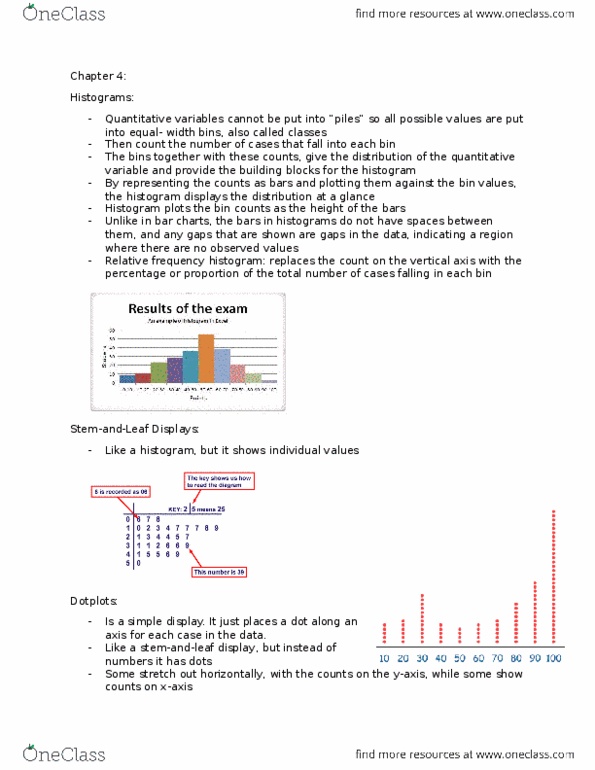
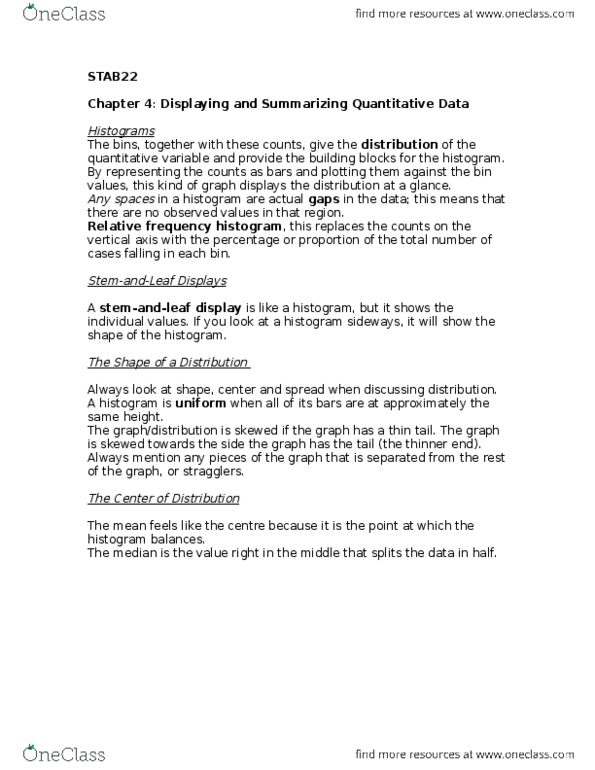
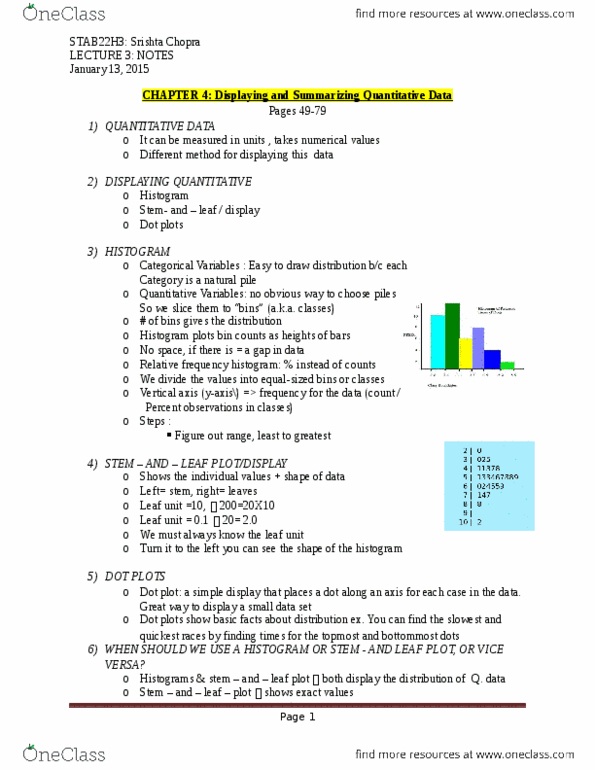
A distribution is a pattern of variation of a variable. It is easy to draw a bar chart for categorical variables because each category is a natural pile. However, we cannot do the same with quantitative variables. Instead, we put all the possible values in equal-width bins, and count the # of cases falling into each bin. A histogram represents the counts as bars and plots them against bin values. If a value falls exactly on a bin boundary, we usually put in into the higher bin. We can build a relative frequency histogram/distribution by dividing the bin frequencies by the total number of cases. These are like histograms, but they show individual values. If you turn a stem-and-leaf on its side, it should look like the histogram of the same data (with higher values on the opposite side). Sometimes, unusual values are listed at the bottom and/or top.