STAB22H3 Chapter Notes - Chapter 9: Box Plot, Decimal Mark, Dependent And Independent Variables


38
STAB22H3 Full Course Notes
Verified Note
38 documents
Document Summary
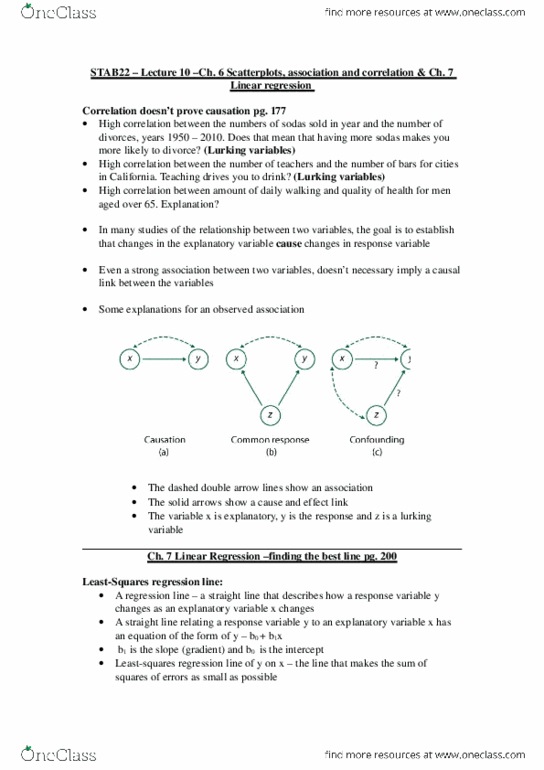
High correlation between #sodas sold in year and #divorces, years 1950-2010. Over that time, population increased, so changes in both variables are caused by that. Observe that smokers have higher blood pressure on average than non-smokers. Causation could be other way: high blood pressure causes smoking. High correlation between #teachers and #bars for cities in california. Sizes of city controls number of teachers and number of bars. * bigger city-> some have more teachers and bars. High correlation between amount of daily walking and quality of health for men aged over 65. Maybe people warned about their health are walking more. Positive relationship between #ski accidents and waiting time for ski lift for each day during one winter at ski resort. Having to wait a long time makes people impatient. More people at the resort will cause longer lines for the lift. Correlation is not causation: cause and effect could be reversed or there could be a 3rd variable.