STAB22H3 Chapter Notes - Chapter 4: Standard Deviation, Decimal Mark, Unimodality


38
STAB22H3 Full Course Notes
Verified Note
38 documents
Document Summary
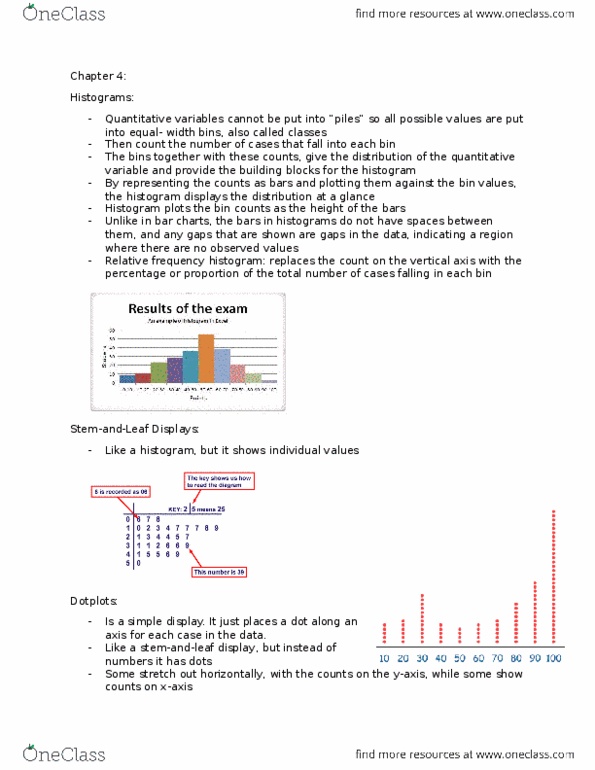
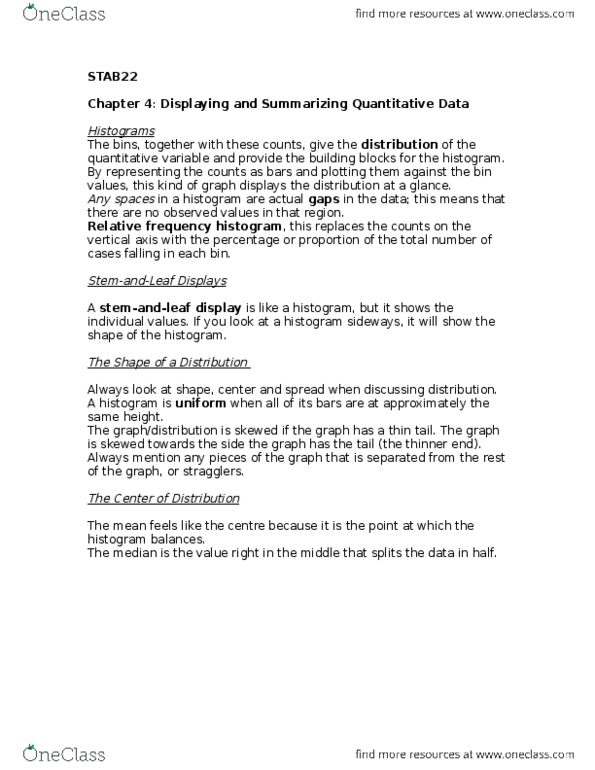
Ch 4: displaying and summarizing quantitative data (p. 49) Distribution -> mostly quantitative variables slices up all the possible value of the variable into equal width bins and gives the number of values falling into each bin. Bins/ classes -> all possible values of equal width -> give distribution of quantitative variable -> Sometimes there are gaps in the data = no observed data. Relative frequency histogram -> replace counts on the vertical axis with the percentage or proportion of the total number of cases falling in each bin. *histogram displays the entire distribution of cereal consumed. Divide data values into stems and leaves, plot separately. Eg. data 17, 19, 21, stems as 10s (leaves as 1s): 21: stem 2, leaf 1: plot all stems on left, add leaves to appropriate stem: 2: 1: you choose what units for stems. e. g. cereal calories stemplot. Same shape as histogram (turned on side) Unusual values listed at top and bottom.