STAB22H3 Chapter Notes - Chapter 6: Scatter Plot


38
STAB22H3 Full Course Notes
Verified Note
38 documents
Document Summary
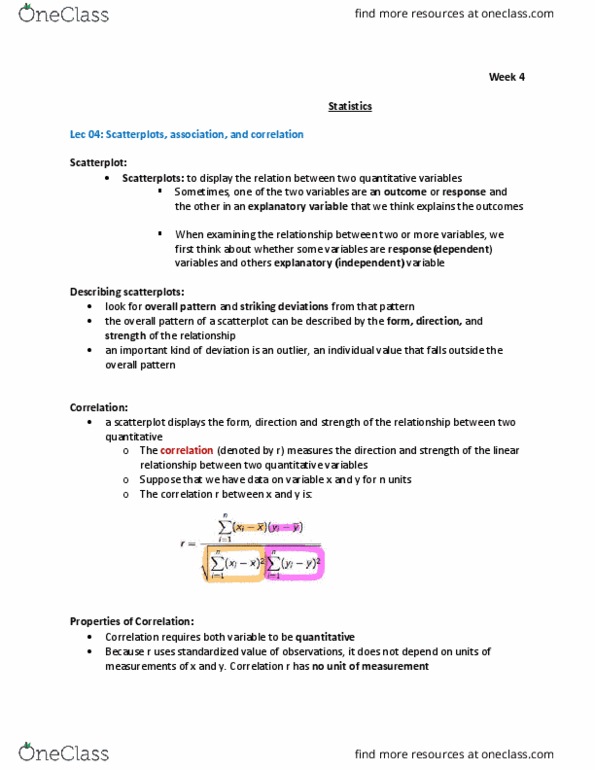
Stab22 - chapter 6: scatterplots, association, and correlation. Scatterplot: displays the relationship between two quantitative variables when plotted against each other. It is helpful in determining relationships, patterns, and trends. Outcome/response variable: shows the outcome or response and is the variable that a person is interested in. This is also known as the dependent variable that lies on the y-axis. This is also known as the independent variable that lies on the x-axis. Overall patterns: describes the major patterns in a scatterplot: direction: describes the pattern of the data. When one variable that increases causes another variable to increase, the pattern of the data is in a positive direction. This is indicated if the data runs from the lower left to the upper right. If the data runs the opposite way, it is in a negative direction. This indicates that as one variable increases, the other decreases: form: describes the type of line.