PSYA01H3 Chapter Notes - Chapter 2.4: Statistical Hypothesis Testing, Standard Deviation, Central Tendency

Document Summary
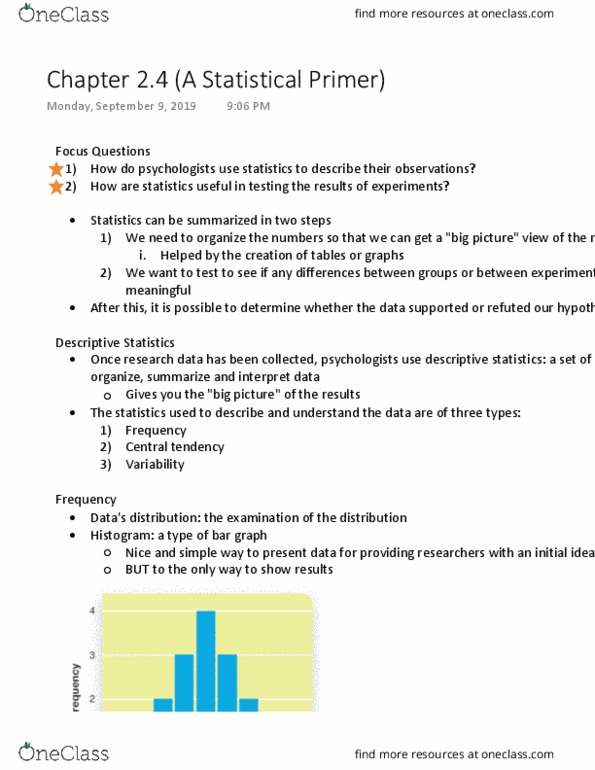
Descriptive statistics a set of techniques used to organize, summarize, and interpret data. In most research, the statistics used to describe and understand the data are of three types: frequency, central tendency, and variability. With most bar graphs, the vertical axis of graphs shows the frequency. Frequency the number of observations that fall within a certain category or range of scores. Normal distribution (bell curve) a symmetrical distribution with values clustered around a central, mean value. Negatively skewed distribution a distribution in which the curve has an extended tail to the left of the cluster. Positively skewed distribution a distribution in which the long tail is on the right of the cluster. Imagine a hard exam was written and most people in the course would have low courses, with only a few stellar students getting as. Central tendency a measure of the central point of a distribution.