BIOB50H3 Chapter Notes - Chapter 10: Survivorship Curve, Life Table, Dall Sheep

27 Oct 2016
School
Department
Course
Professor

Document Summary
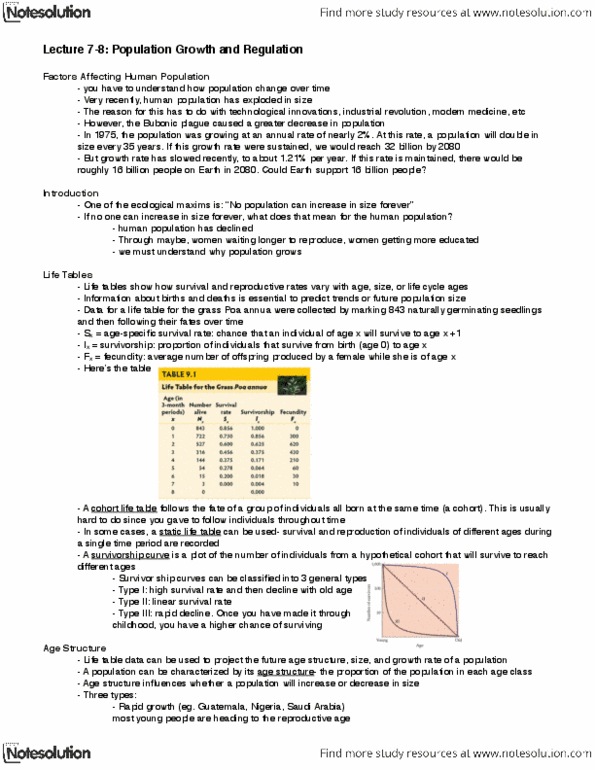
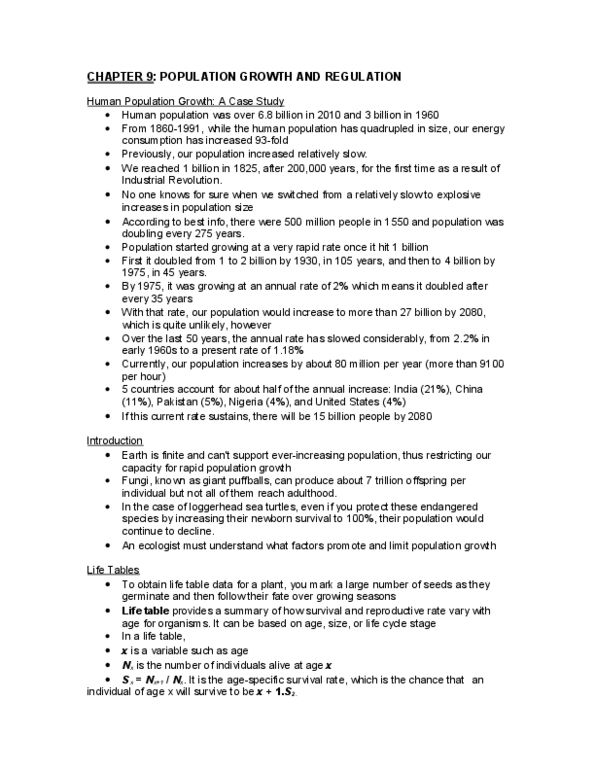
Case study: human population growth figure 10. 1, 10. 2. 1975: human population grows at an annual rate of nearly 2% at this rate, a population will double in size every 35 years. If this growth rate were sustained, we would reach 26 billion by 2080. Recently, growth rate has slowed, to about 1. 1% per year. If this rate is maintained, there would still be more than 14 billion people on earth in 2080. One ecological maxim: no population can increase in size forever. Using life tables, scientists are used to find a way to protect newborn turtles. The tools you will learn in this lecture are used in human demography, ecology, conservation, epidemiology, and agriculture (among others). Understanding the factors that limit or promote population growth helps e. g. with resource management, disease eradication, and determining effective methods of conservation. Life tables show how survival and reproductive rates vary with age, size, or life cycle stage.