STAT151 Chapter Notes - Chapter 2: Bar Chart, Stata, Contingency Table

16 Jan 2016
School
Department
Course
Professor


4
STAT151 Full Course Notes
Verified Note
4 documents
Document Summary
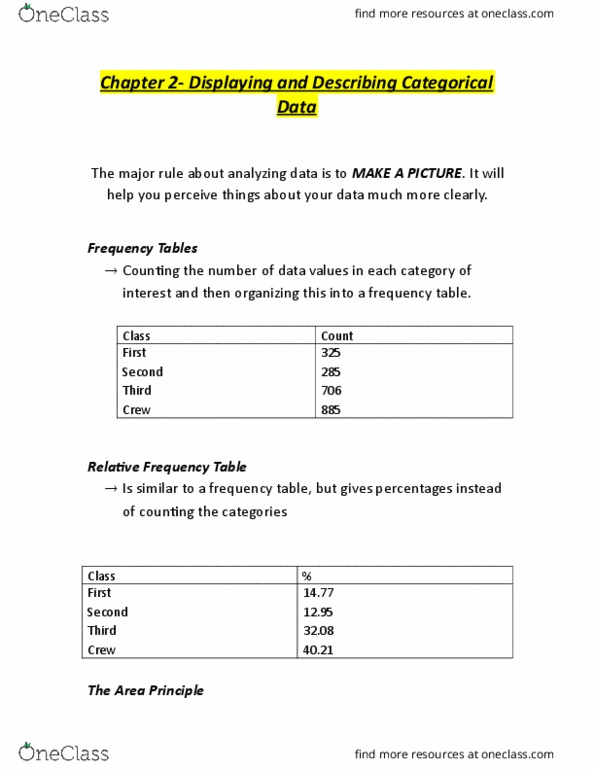
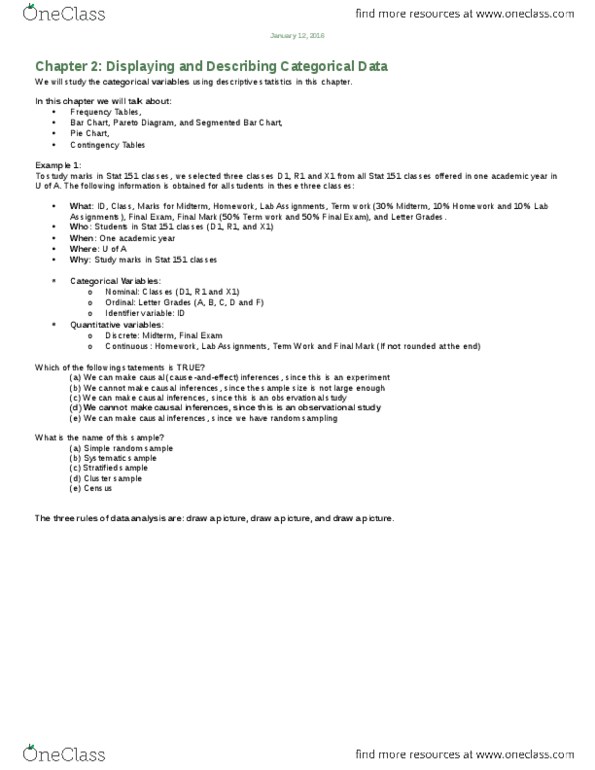
All three rules are the same: make a picture o. The picture will help you think about the subject, show the important features about the subject, and successively tell others about the subject. Both tables show the distribution of a categorical variable. Area principle: the principle that states the area that is occupied by one category in a graph should be proportional to its total value: manipulating/violating this principle is a common form of dishonesty found in statistics. A chart that displays the data in a circle; the slice in which each category sits is proportional to its fraction of the whole. # of students in each stats class section. 2. 2: exploring the relationship between two categorical variables. Contingency table showing the amount of each gender in the 3 stats 151 classes. Contingency table showing the percentage of each gender in the 3 stats 151 classes. Be able to make and understand a frequency table for a categorical variable.