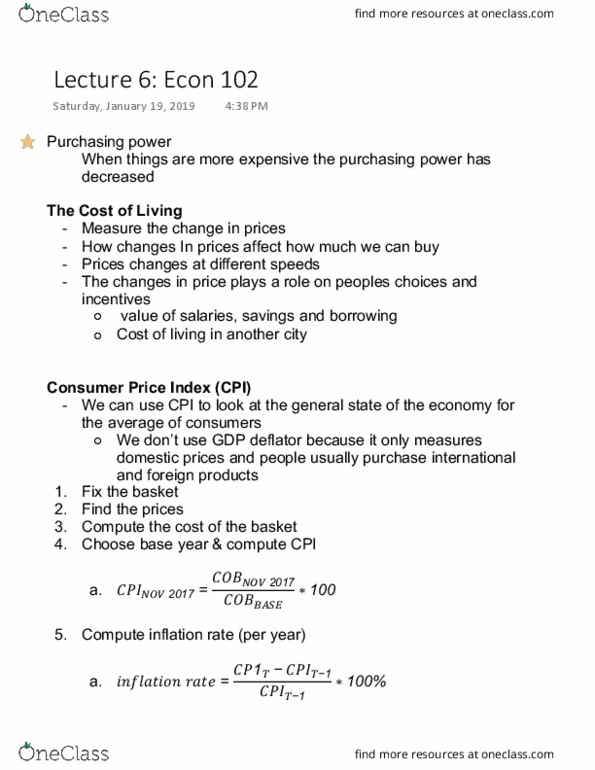
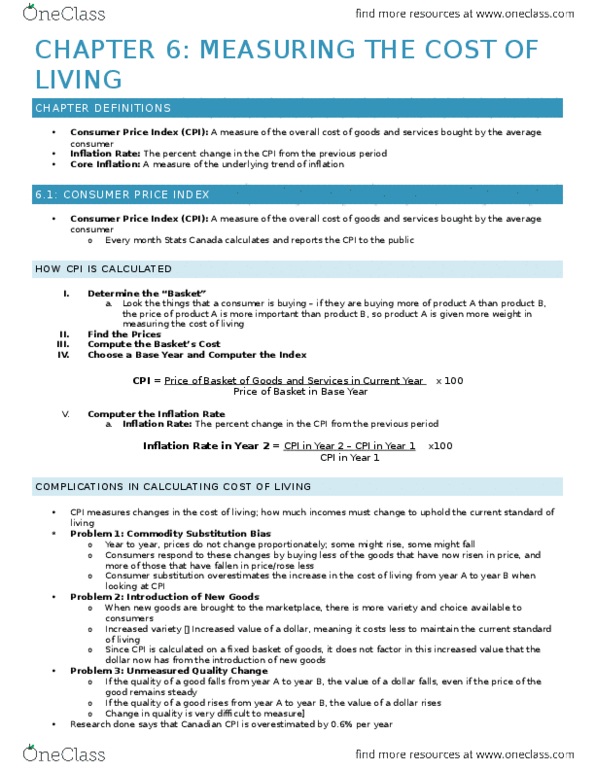
ECON102 Chapter Notes - Chapter 6: Canada Pension Plan, Gdp Deflator, Old Age Security


ECON102 Full Course Notes
Document Summary
Get access


Related Documents
Related Questions
The table below lists annual consumer price index and inflation rates for a country over the period 2005-2010. Assume the year 2005 is used as the base year.
| Year | Consumer Price Index | Inflation Rate |
| 2005 | 100 | |
| 2006 | 115 | B |
| 2007 | 125 | C |
| 2008 | 140 | D |
| 2009 | A | 10% |
| 2010 | 160 | E |
| |||
| 120 | |||
| |||
|
The price index was 170 in the first year, 180 in the second year, and 195 in the third year. The inflation rate was about
| |||
| |||
| |||
|
0.1 points
QUESTION 17
The price index was 150 in the first year, 142.5 in the second year, and 138.2 in the third year. The economy experienced
| 5.0 percent deflation between the first and second years, and 3.0 percent deflation between the second and third years. | ||
| 7.5 percent deflation between the first and second years, and 4.3 percent deflation between the second and third years. | ||
| 5.3 percent inflation between the first and second years, and 4.1 percent inflation between the second and third years. | ||
| 7.5 percent inflation between the first and second years, and 4.3 percent inflation between the second and third years |
0.1 points
QUESTION 18
Which of the following statements is correct about the relationship between the nominal interest rate and the real interest rate?
| |||
| |||
| |||
|
0.1 points
QUESTION 19
If the nominal interest rate is 6 percent and the rate of inflation is 2 percent, then the real interest rate is
| |||
| |||
| |||
|
0.1 points
QUESTION 20
If the nominal interest rate is 7 percent and the real interest rate is -2.5 percent, then the inflation rate is
| 9.5 percent. | |||
| |||
| |||
|
. From 2009 to 2010, the CPI for education increased from 279.3 to 281.8. What was the inflation rate for education between 2009 and 2010?
| 0.9% | |||
| |||
| |||
|
If the consumer price index changes from 125 in September to 150 in October, what is the rate of inflation?
| |||
| |||
| |||
| 9.1% |
. Suppose a basket of goods and services has been selected to calculate the CPI and 2014 has been selected as the base year. In 2013, the basketâs cost was $80; in 2014, the basketâs cost was $86; and in 2015, the basketâs cost was $90. The value of the CPI in 2015 was
| 104.6 and the inflation rate was 4.6%. | |||
| |||
| |||
|
Suppose a basket of goods and services has been selected to calculate the CPI. In 2002, the basketâs cost was $80; in 2008, the basketâs cost was $92; and in 2010, the basketâs cost was $108. The base year must be
| |||
| 2002 | |||
| 2008 | |||
|
Suppose a basket of goods and services has been selected to calculate the CPI and 2012 has been chosen as the base year. In 2012, the basketâs cost was $80.00; in 2013, the basketâs cost was $84; and in 2014, the basketâs cost was $87.60. The value of the CPI was
| ||||
| ||||
| ||||
|
Which of the following is correct?
| |||
| |||
| |||
|
The inflation rate is defined as the
| |||
| |||
| |||
|
Economists use the term inflation to describe a situation in which
| |||
| |||
| |||
|

1) Assume there is a simple economy where people consume only 2 goods, food, and clothing. Further, assume that the market basket of goods used to compute the CPI consists of 100 units of food and 20 units of clothing.
|
|
Food |
Clothing |
|
2004 price per unit |
$8 |
$20 |
|
2005 price per unit |
$12 |
$40 |
Compute the percentage changes in the price of food and the percentage change in the price of clothing between 2004 and 2005.
Calculate the percentage change in the CPI between 2004 and 2005.
Do you think the CPI price changes affect all consumers in the economy to the same extent? Explain.
2) Calculate how much each of the following items is worth in terms of today's dollars using 180 as the price index for today.
a. In 1925, the CPI was 18 and the price of a movie ticket was $0.30.
b. In 1930, the CPI was 14 and a cook earned $20 a week.
c. In 1940, the CPI was 16 and a gallon of gas cost $0.20.
3) The table below uses data for 3 hypothetical countries. All the number values are in thousands. Complete the blank entries in the table below.
|
Country |
Adult Population |
Labor Force |
Employed |
Unemployed |
Unemployment Rate |
Labor-Force Participation Rate |
|
A |
120,000 |
60,000 |
4,500 |
|||
|
B |
28,000 |
3,000 |
60 |
|||
|
C |
70,000 |
40,000 |
10 |
4) The following table indicates U.S. real GDP data. Calculate real GDP per person for 1987 and 2005. Then use real GDP per capita to compute the percentage change in real GDP per person from 1987 to 2005.
|
Year |
Real GDP (2000 prices) (in million) |
Population (in million) |
|
1987 |
$6,435,000 |
243 |
|
2005 |
$11,092,000 |
296.6 |
