QMS 102 Chapter Notes - Chapter 4: Descriptive Statistics, Central Tendency, Interquartile Range

2 Jan 2018
School
Department
Course
Professor
Document Summary
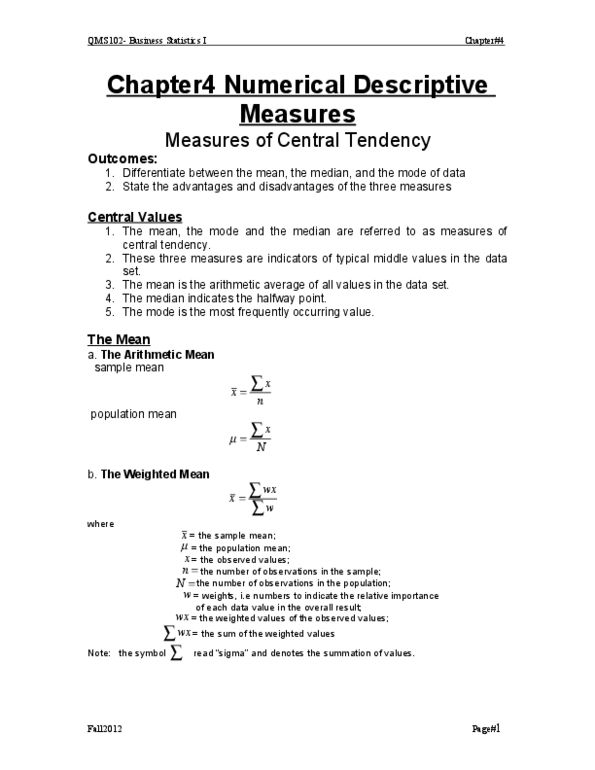
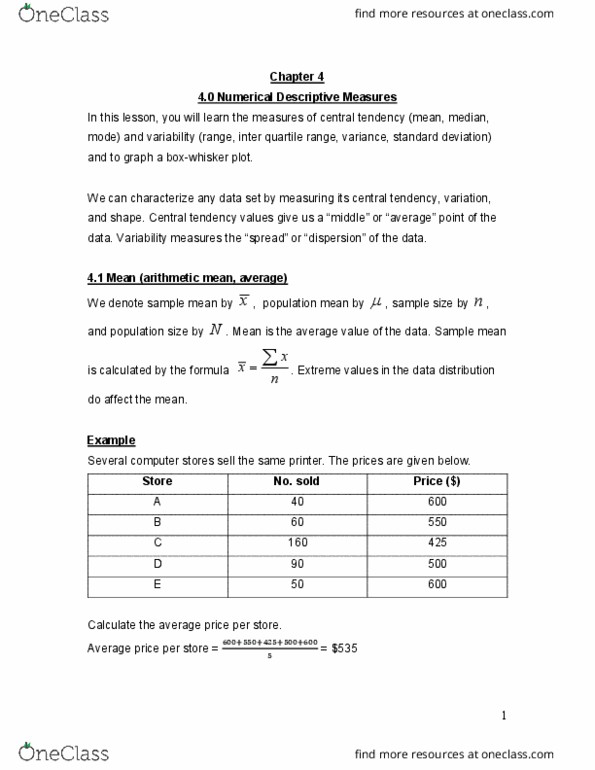
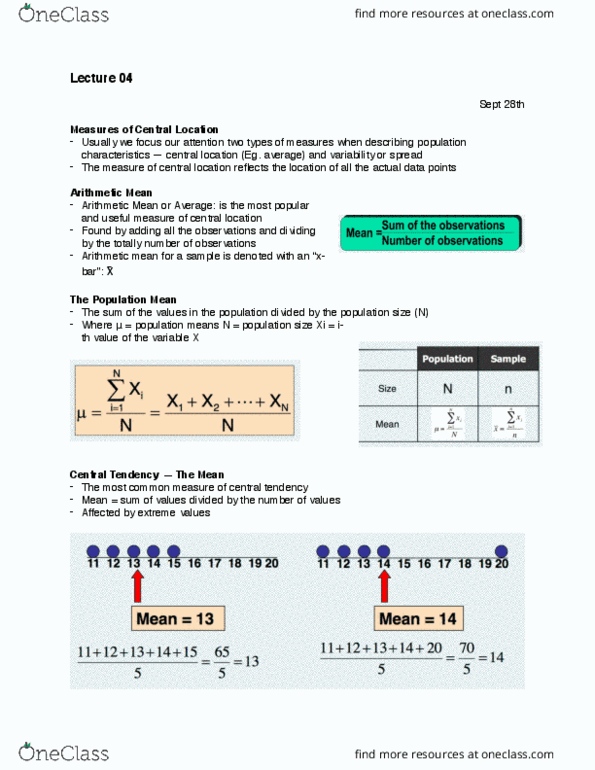
Graphing tips: not distort data, scale at zero, axes labeled, title. Descriptive statistics are numbers calculated to describe various aspects of a data set. Measures of central tendency: a single value to represent that data set: mode mean median. Measures of variability: a single value to describe how spread out the data are. Parameter: descriptive measure derived from population data (contains all possible elements) Statistic: descriptive measure derived from sample data (contains a subset of data drawn from a population) Mean (average) - sample mean = population mean = . Formula x - a value in the data set n - sample size. Weighted mean formula: x = ( wx)/( w) w - the number of employees. Arithmetic mean is the most important measure of central tendency. Median: middle value in an ordered array (ascending). Odd - middle number, even - average of two middle numbers. X - add up the data x - the salaries therefore.