ECON1101 Chapter Notes - Chapter all: Indirect Tax, Normal Good, Inferior Good


Chapter 1: The Foundations of Economics
Topic
Diagram
Explanation
Production
Possibilities
Model (PPC)
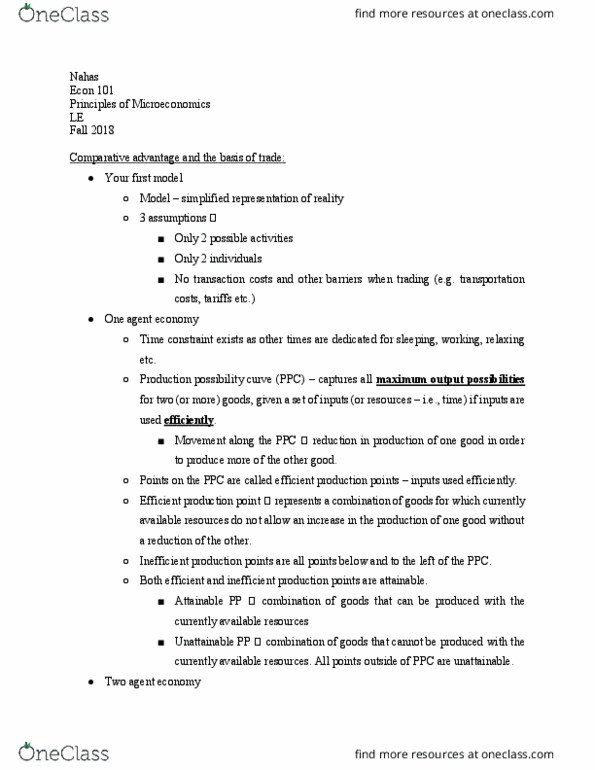
- The PPC shows the maximum qualities of two
goods that can be produced with its available
resources and technology.
- To produce on the PPC (B, C, D)
➔Full employment of all resources
➔All resources must be used efficiently.
If either one of both conditions do not hold, the
economy will produce at point inside the PPC (F).
-The PPC suggests the following assumption:
❏Due to scarcity, it is impossible to produce
outside PPC (G).
❏Due to scarcity, it is necessary to make
choices.
❏Choices give rise to opportunity cost.
Chapter 2: Competitive Markets - Demand and Supply
Topic
Diagram
Explanation
Movement
along the
demand curve
caused by a
change in price
of good (2.4)
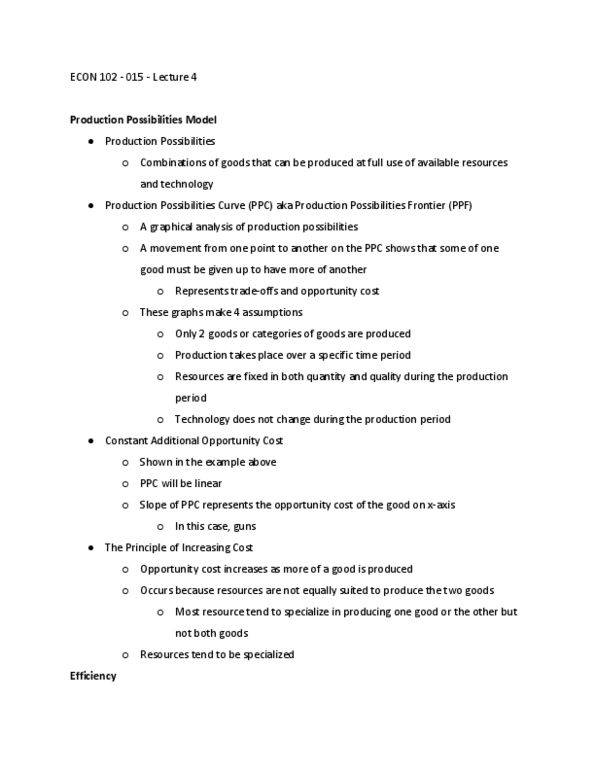
- A change in price of the good caused a movement
along the demand curve.
- According to the law of demand, if P decreases, Q
increases, there is a downward movement from (A
=> B). The change in Q due to the change is P is
called change in quantity demanded.
Shift of the
demand curve
due to non-price
determinants of
demand (2.4)
- A change in any of non-price determinants of
demand will result to a shift of the demand curve.
- A rightward shift indicates an increase in demand
(D1 to D2). A leftward shift indicates a decrease in
demand (D1 to D3). The change in Q due to the
shifts in D is called a change in demand.

Movement
along the
supply curve
caused by a
change in price
of good (2.8)
- A change in price of the good caused a movement
along the supply curve.
- According to the law of supply, if P increases, Q
increases, there is a upward movement from (A =>
B). The change in Q due to the change is P is called
change in quantity supplied.
Shift of the
supply curve
due to non-price
determinants of
demand (2.8)
- A change in any of non-price determinants of
demand will result to a shift of the supply curve.
- A rightward shift indicates an increase in supply
(S1 to S2). A leftward shift indicates a decrease in
supply (S1 to S3). The change in Q due to the shifts
in D is called a change in supply.
Market
equilibrium (2.9)
- Market Equilibrium -> quantity demanded (Qd) =
quantity supplied (Qs). Shown by the intersection of
D and S curve, resulting to a Pe (equilibrium price)
and Qe (equilibrium quantity).
➔P > Pe - excess supply = surplus Qd>Qs
➔P < Pe - excess demand = shortage Qd<Qs
★If there is shortage, the excess demand will
ensure that P increases to Pe
★If there is a surplus, the excess supply will
ensure that P decreases to Pe.
Increase in
demand and the
new equilibrium
price and
quantity (2.10)
- D1 intersects S at point a (initial equilibrium)
resulting to P1 and Q1.
- A change in determinant of demand causes
demand curve to shift to the right (D1 to D2).
- Given D2 at initial price P1, there is movement to
point B, which results to excess demand (Qd > Qs).
P therefore increases causing movement up to point
c in D2, where excess demand is eliminated.
- At c, there is higher Pe and Qe given by
intersection of D2 with S.

Decrease in
demand and the
new equilibrium
price and
quantity (2.10)
- D1 intersects S at point a (initial equilibrium)
resulting to P1 and Q1.
- A change in determinant of demand causes
demand curve to shift to the left (D1 to D3).
- Given D3 at initial price P1, there is movement to
point B, which results to excess supply (Qd < Qs). P
therefore decreases causing movement down to
point c in D2, where excess supply is eliminated.
- At c, there is lower Pe and Qe given by intersection
of D3 with S.
Increase in
supply and the
new equilibrium
price and
quantity (2.11)
- S1 intersects D at point a (initial equilibrium)
resulting to P1 and Q1.
- A change in determinant of supply causes supply
curve to shift to the right (S1 to S2).
- Given S2 at initial price P1, there is movement to
point B, which results to excess supply (Qs > Qd). P
therefore decreases causing movement down to
point c in S2, where excess supply is eliminated.
- At c, there is lower Pe and Qe given by intersection
of S2 with D.
Decrease in
supply and the
new equilibrium
price and
quantity (2.11)
- S1 intersects D at point a (initial equilibrium)
resulting to P1 and Q1.
- A change in determinant of supply causes supply
curve to shift to the left (S1 to S3).
- Given S3 at initial price P1, there is movement to
point B, which results to excess demand (Qd > Qs).
P therefore increases causing movement up to point
c in S3, where excess demand is eliminated.
- At c, there is lower Pe and Qe given by intersection
of S3 with D.
Price as a
signal and
incentive (2.16)
- Change in non-price determinants shift demand
curve from D1 to D2. At the initial price P1, a
shortage is indicated between the difference
between Q2 and Q1. The Qd, Q2 is larger than Qs,
Q1. The price of good will begin to rise and will
continue to rise until the shortage has disappeared.
This occurs at P2 and Q3 given by intersection of S
and D2.
- The new P signalled to producer that a shortage
had emerged. The increase in P is also an incentive
Document Summary
The ppc shows the maximum qualities of two goods that can be produced with its available resources and technology. To produce on the ppc (b, c, d) If either one of both conditions do not hold, the economy will produce at point inside the ppc (f). Due to scarcity, it is impossible to produce outside ppc (g). Due to scarcity, it is necessary to make choices. Chapter 2: competitive markets - demand and supply. Movement along the demand curve caused by a change in price of good (2. 4) Shift of the demand curve due to non-price determinants of demand (2. 4) A change in price of the good caused a movement along the demand curve. According to the law of demand, if p decreases, q increases, there is a downward movement from (a. The change in q due to the change is p is called change in quantity demanded .