ACT202 Chapter Notes - Chapter 3: Cost Driver, Cost Estimate, Management Accounting


ACT 202 Management Accounting
How cost behave
Basic assumptions and examples of cost functions
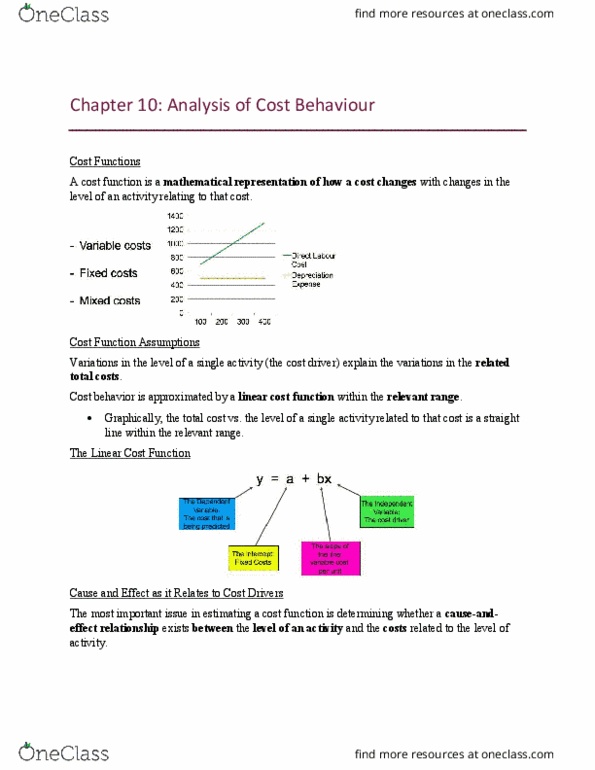
• A cost function is a mathematical representation of how a cost changes with changes in the
level of an activity relating to that cost.
Variations in the level of a single activity (the cost driver) explain the variations in the related
total costs.
• Cost behaviour is approximated by a linear cost function within the relevant range:
– represented graphically, the total cost versus the level of a single activity related to that
cost is a straight line within the relevant range.
Review of cost classification
Choice of cost object – different objects may result in different classifications of the same
cost.
Time horizon – the longer the period, the more likely the cost will be variable.
Relevant range – behaviour is predictable only within this band of activity.
Identifying cost drivers
• Cost estimation measures a relationship based on data from past costs and the related level
of an activity.
• Cost predictions are forecasts of future costs.
• Better cost predictions help managers make planning and control decisions that are more
informed.
The cause-and-effect criterion in choosing cost drivers
• The most important issue in estimating a cost function is determining whether a cause-and-
effect relationship exists between the level of an activity and the costs related to that level of
activity.
• A cause-and-effect relationship might arise as a result of:
– a physical relationship between the level of activity and costs
– a contractual agreement
– knowledge of operations.
• Note – a high correlation (connection) between activities and costs does not necessarily
mean causality.
Cost estimation methods
• Industrial engineering method
• Conference method
find more resources at oneclass.com
find more resources at oneclass.com
Document Summary
Basic assumptions and examples of cost functions: a cost function is a mathematical representation of how a cost changes with changes in the level of an activity relating to that cost. Variations in the level of a single activity (the cost driver) explain the variations in the related total costs: cost behaviour is approximated by a linear cost function within the relevant range: Represented graphically, the total cost versus the level of a single activity related to that cost is a straight line within the relevant range. Choice of cost object different objects may result in different classifications of the same cost. Time horizon the longer the period, the more likely the cost will be variable. Relevant range behaviour is predictable only within this band of activity. A physical relationship between the level of activity and costs. Knowledge of operations: note a high correlation (connection) between activities and costs does not necessarily mean causality.