STAT1008 Chapter Notes - Chapter 10: Dependent And Independent Variables, Stepwise Regression

Document Summary
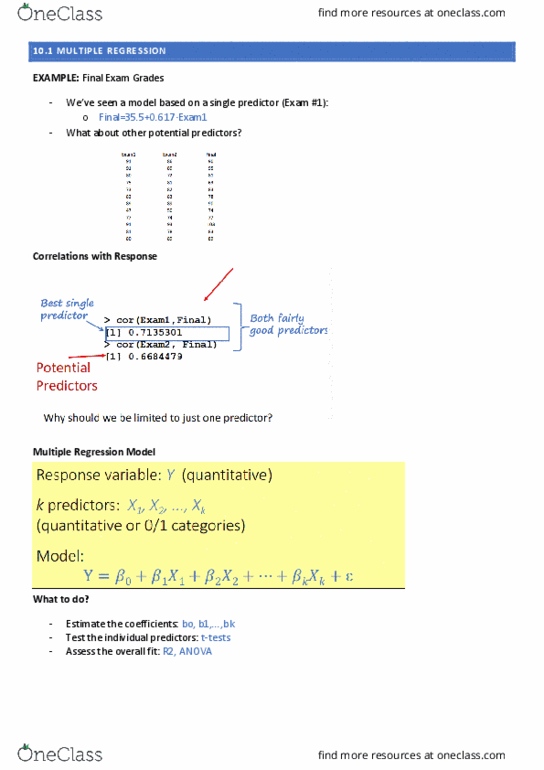
Response variable: y (quantitative) k predictors: x1, x2, , xk (quantitative or 0/1 categories) Model: y= 0 + 1x1 + 2x2 + + kxk + . R 2: % of variability in y which is explained by the model. Look at correlations between individual predictors and the response variable. Look at p-values from the individual t-test in the multiple regression. Look at p-value from the anova for overall t. Compare std. dev. of the error term, s between models. Adjusted r 2 is like r 2, but takes into account the number of explanatory variables (k). As the number of explanatory variables increases, adjusted r 2 gets smaller than r 2. Another criteria for choosing models is a large adjusted r 2. Ways of deciding whether a variable should be included in the model or not: Is it strongly associated with another explanatory variable? ( if yes, then including both may be redundant) Start with a model with all predictors.