ECON1102 Chapter Notes - Chapter 10: Real Interest Rate, Aggregate Supply, Aggregate Demand


Chapter 10: Aggregate Demand and Aggregate Supply Analysis
Aggregate Demand:
Aggregate Demand and Aggregate Supply Model: A model that explains short-run
fluctuations in real GDP and the price level
• AD → show relationship between price level and the quantity of real GDP
demanded by households, firms and government
• AS → shows relationship between price level and the quantity of real GDP
supplied by firms
Aggregate Demand (AD) Curve: A curve that shows the relationship between the
price level of the quantity of real GDP demanded by households, firms, and the
government
• Downward-sloping
- Wealth effect (change in price level affects real wealth and hence
consumption)
- Interest-rate effect (change in the price level affects real interest rate
and hence investment – primarily)
- The international-trade effect (a change in the price level affects
relative real price of foreign and domestic goods and also international
exchange rates and hence net exports)
Short-run Aggregate Supply (SRAS) Curve: A curve that shows the relationship in
the short run between the price level of the quantity of real GDP supplied
Wealth Effect: How a Change in the Price Level Affects Consumption:
- Wealth effect: ΔP affects consumption
- Interest rate effect: ΔP affects investment
- International Trade Effect: therefore ΔP affect net exports
- Price increases → real value of household wealth decreases and consumption
decreases (wealth effect)
The Interest-Rate Effect: How a Change in the Price Level Affects Investment:
- Increase in price → demand for funds increase – increase rate increases and
investment decreases (decrease consumption)
The International-Trade Effect: How a Change in Price Level Affects Net Exports:
- Increase in price → decrease in exports, imports increase → net exports
decrease and AD decreases
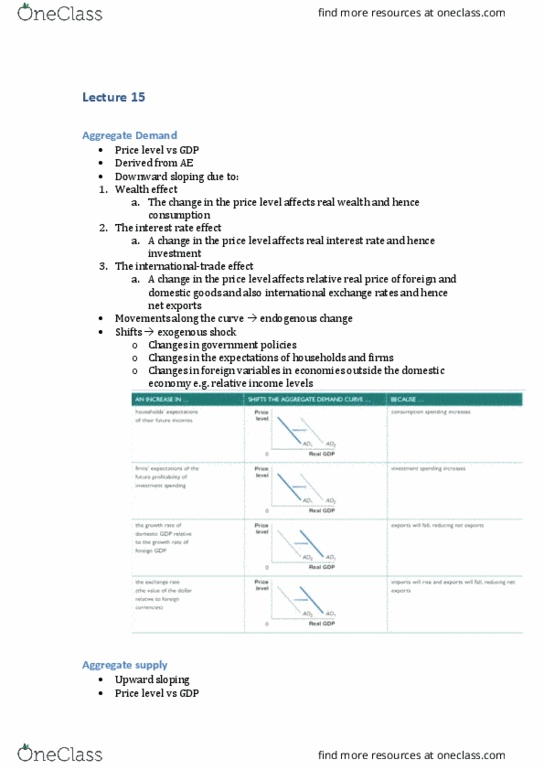
Shifts of the Aggregate Demand Curve Versus Movements Along It:
Variables that Shift the Aggregate Demand Curve:
1. Changes in government policies (fiscal and monetary policy)
• Fiscal: Change in government spending and taxes (to achieve
macroeconomic objectives)
• Monetary: Change in interest rates
• Government purchases are a component of aggregate demand →
therefore increase shifts the AD curve to the right (visa versa)
find more resources at oneclass.com
find more resources at oneclass.com

• Higher personal income tax → shift the AD curve to the right
• Lower interest rates → lower the cost to firms and households of
borrowing (lower borrowing → increase consumption and investment
spending – shifts curve to right)
2. Changes in the expectations of households and firms
• If households become optimistic → increase in consumption
• Increase consumption shifts curve to the right
3. Changes in foreign variables outside the domestic economy
• Net exports fall (buy more foreign goods) → AD curve will shift to the left
• Net exports fall if the exchange rate between dollar and foreign currencies
rises
• Net exports increase → shift AD curve to right
• If real GDP grows more slowly in Australia than other countries/value of dollar
falls against other currencies → net exports will increase
• A change in net exports that results from a change in the price level in
Australia will not cause the AD curve to shift (this is a movement along
the AD curve)
• Appreciation → NX increase
• Depreciation → NX decrease
Aggregate Supply:
• Short run and long run
Long-run Aggregate Supply (LRAS) Curve: A curve that shows the relationship in the
long run between the price level and the quantity of real GDP supplied
• LR GDP determined by capital stock
• Changes in price level do not affect capital stock → therefore do not affect the
level of real GDP
• Vertical line at potential GDP
Shifts in the long-run aggregate supply curve
→
increases in potential GDP
1. Increase in resources → e.g. migrant workers/new mineral discoveries
2. An increase in the quantity of machinery and equipment used in production
3. New technology or more productive ways of using resources
Note: Above factors also shift the short-run aggregate supply curve
The Short-Run Aggregate Supply Curve:
• Upward sloping → over short run as the price level increases the quantity of
goods and services firms are willing to supply will increase
• As prices of final goods increase, prices of inputs rise more slowly
• As price level rises or falls, some firms are slow to adjust their prices
• Some firms and workers fail to predict accurately changes in the price level (if
firms/workers could predict the future price level exactly the SRAS curve
could be the same as the LRAS curve)
Three theories to ‘explain’ upward slope of short-run aggregate supply curve:
1. Money illusion
• People can misread inflation as higher or lower than it actually is
find more resources at oneclass.com
find more resources at oneclass.com
Document Summary
Chapter 10: aggregate demand and aggregate supply analysis. Aggregate demand (ad) curve: a curve that shows the relationship between the price level of the quantity of real gdp demanded by households, firms, and the government: downward-sloping. Wealth effect (change in price level affects real wealth and hence consumption) Interest-rate effect (change in the price level affects real interest rate and hence investment primarily) The international-trade effect (a change in the price level affects relative real price of foreign and domestic goods and also international exchange rates and hence net exports) Short-run aggregate supply (sras) curve: a curve that shows the relationship in the short run between the price level of the quantity of real gdp supplied. Wealth effect: how a change in the price level affects consumption: Price increases real value of household wealth decreases and consumption. International trade effect: therefore p affect net exports decreases (wealth effect) The interest-rate effect: how a change in the price level affects investment: