STATS 10 Study Guide - Final Guide: With Confidence, Random Assignment, Probability Distribution

Document Summary
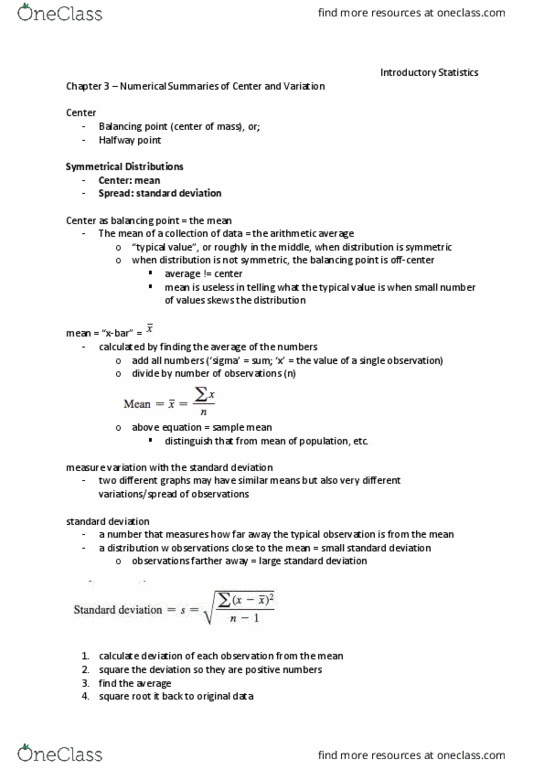
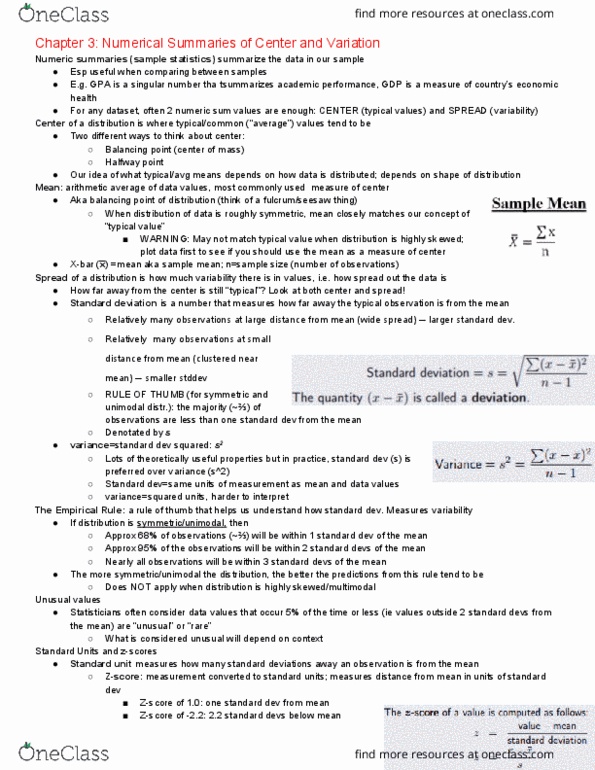
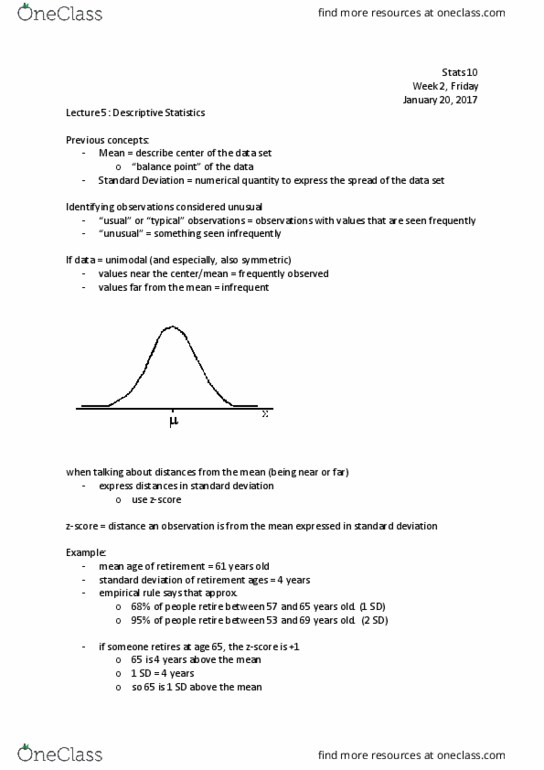
Standard deviation : described by the square root of the variance (represents the typical distance of a value from the mean) (x - x ) means to take each data point, subtract the mean, and then square the difference called a deviation. (sigma) means to add up all the deviations. N = the total number of data values. The empirical rule : a rough guideline (rule of thumb) that helps us understand how the. If a distribution is unimodal and symmetric: standard deviation measures variability. About 68% of the observations fall within one standard deviation of the mean. About 95% of the observations fall within two standard deviations of the mean. About 99. 7% (nearly all) of the observations fall within 3 standard deviations of the mean. Z-scores : standardized scores (denoted as z) that are used to compare individual data values to their mean, relative to their standard deviation z = x x s.