MGMT 7 Study Guide - Midterm Guide: Interquartile Range, Quartile, Pie Chart

15 Jan 2017
School
Department
Course
Professor
Document Summary
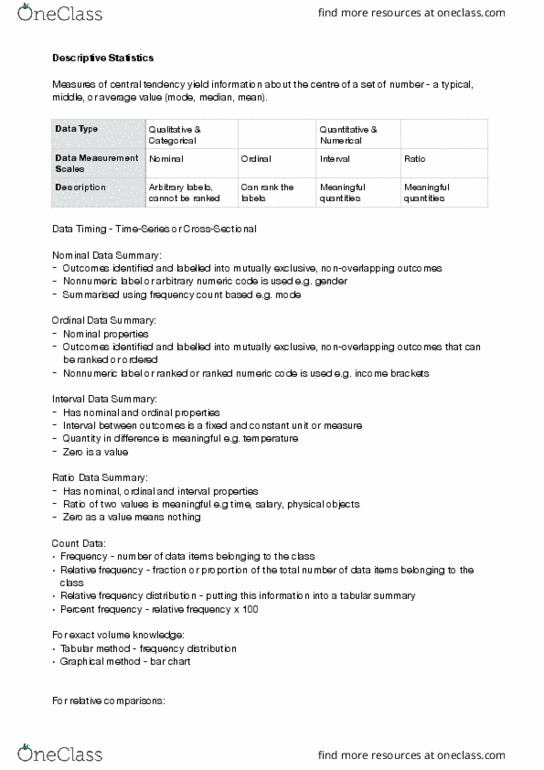
Total # of data in a data set = # of (cid:858)n(cid:859) ele(cid:373)e(cid:374)ts (cid:272)o(cid:374)tai(cid:374)s (cid:858)(cid:374)(cid:859) o(cid:271)servatio(cid:374)s. Variables = characteristics elements x # of variables. Categorical data: numeric or nonnumeric, either nominal or ordinal. Quantitative data: numeric only, either interval or ratio, how many (discrete) or how much (continuous) Relative frequency of a class = frequency of the class/n (n=total sample size) (adds up to 1. 0) Frequency = total sample size x relative frequency. Ordinal: deals with order/rank (class standing: freshman, sophomore) Ratio: ratio of two values, must contain a zero value (distance, height, weight, time) Class width = (largest data value smallest data value)/# of classes. % cumulative (cid:1095) 19 (cid:1095) 29 (cid:1095) 39 (cid:1095) 49 (cid:1095) 59. Symmetric: skewness = 0, mean = median negative, mean < median. Sample mean: (cid:454) = xi/n population mean: = xi/n weighted mean (if data is from a population, replaces (cid:454) ): (cid:454) = wixi/ wi.