MAT 221 Midterm: MAT_221_SP_15


MAT
221
Final
Exam
Spring
201
5
Instructions:
• Check
that
there
are
7 questions in this exam.
• Show your work
or
reasoning wherever possible
to
receive full credit.
• Use complete sentences wherever applicable.
• You may use a calculator for arithmetics only. Answers obtained with a statistic function in
a calculator receive no credit.
Question Points Score
1 20
2
12
3 (a)
-(
d) 10
3 (e) 10
3 (f)
12
4 12
5 10
6 7
7 7
Total 100
'

MAT
221
-
Spring
2015
Final Exam Formulae
Formulae:
• Sx =
J(x1
~
x}
2 + (x2 -x}2 + (xa -x}2 + · · · + (xn -
x}
2
n - 1
• r
---
---
---
+ · ·· +
--
--
_ 1
[(Xt
-x)
(Yl
-
y)
(Xn
-
X)
(Y
n -
y)
]
n -1 Sx Sy Sx
Sy
• Least Squares Regression Line: y =
bo
+
b1x
where
b1
= r
~
and
bo
= y -
bi
x.
S
:z:
• Residual
at
a
data
point (
x,
y) is y -y
""
Observed y -Predicted
y.
•
If
X is a discrete random variable taking on values x1,
...
,
Xk
with respective probabilities
Pt,
. . . ,Pk ,
then
the
mean is
µx
= x1p1 + · · · +
XkPk,
the
variance is
a}
=
(x1
-µx )2
Pt
+ · · · + (xk -
µx
)2
Pk,
and
the
standard
deviation
is
ax
=
~-
•
If
Y z
a+
bX,
then
µy
= a + bµx and
a}
= b
2
a}.
• Rules of Probabilities:
-
If
A and B
are
disjoint events, P (A and B ) = 0.
-P (A
or
B)
= P (A} +
P(B}
-
P(A
and
B)
P (A and B )
-
If
P(
B)
> O then
P(A
I
B)
= P (B ) .
-
If
A and B are independent events, P (A and B ) = P (A)
P(B}
.
• Sampling distribution of Sample Mean
Xn
from a SRS of size n from a population with
mean
µ and population
st
andard deviation a:
-
If
the
sample is from a normal distribution, then Xn is Normal
N(µ,a/,/n)
regardless
of
the sample size n.
-If n
~
30,
then
Xn is approximately Normal N {µ , a / ,/n) regardless
of
the
population
distribution.
• Sampling Distribution of
Sa
mple Count X and Sample Proportion p = X / n:
-
If
np
2::
10 and n (l - p)
2::
10, then X is approximately Normal
N (µ = np, a = J np(l -p)).
-
If
np
2::
10 and n(l - p)
~
10,
then p = X / n
is
approximately Normal
N (µ = p, a = J p(l -p}/n).
• When
Xn
is (approximately) Normal N (µ, a/
,/n)
and
a is known, confidence
int
erval for
the
population mean µ is Xn ± z•
Jn'

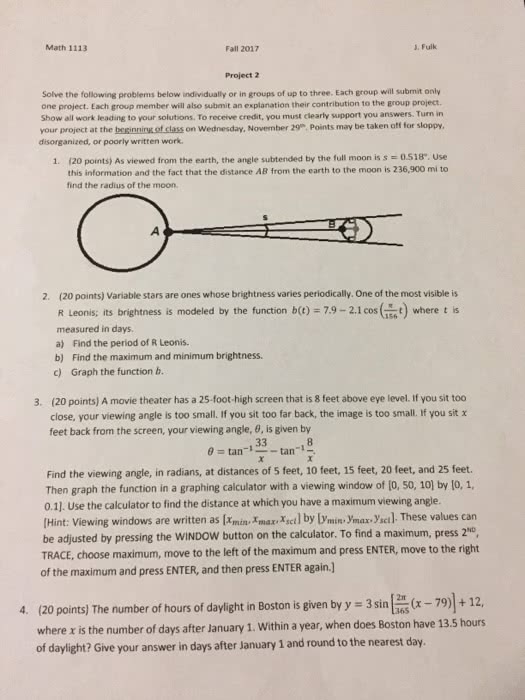
1. (20 points)
In
each
of
the
following problems, circle
the
correct choice:
(a)
The
standard
deviation
of
a
data
set
measures
the
______
of
the
data
set.
o most frequent value o variability o size o center
(b)
If
the
z-score corresponding to
the
weight
of
a newborn
baby
is 3, which
of
the
following
statements
best
describes
the
baby's weight?
o This is a very heavy baby in comparison
to
other
newborn babies.
o This is a very light baby in comparison
to
other
newborn babies.
o This is
an
average weight baby.
o This
is
a somewhat above average weight baby
(c) Sample
data
show
that
the
regression line relating weight (in pounds) and daily caloric
intake (in calories) for
adults
is: caloric
intake=
(5.28)( weight)+ 1015. An interpretation
of
the
slope is:
o
The
adult
whose weight is 1 pound higher is predicted
to
consume 5.28 more calories.
o
The
adult
whose weight is 1 pound higher is predicted
to
consume 1015 more calories.
o If caloric intake is increased by one calorie, the weight is predicted
to
increase by 5.28
pounds.
o
If
caloric intake is increased by one calorie,
the
weight
is
predicted
to
increase by
1015 pounds.
(d) Suppose
that
for
Xis
net
amount
won
or
lost in a lottery game.
The
mean
of
Xis
-$0.50.
What
is
the
correct interpretation
of
this value?
o
The
most likely outcome
of
a single play is a
net
loss
of
50 cents.
o A player will have a
net
loss
of
50 cents every single time
he
or
she
plays this game.
o Over a large number
of
plays the average outcome
per
play is a
net
loss of 50 cents.
o A mistake must have been made because
its
impossible for a mean
to
be
negative
(e) Suppose
we
would like
to
display
data
on
the
amount
of
financial aid each
student
received
this
year in a graph.
What
would be
the
best
graph
to
use?
o
Bar
Graph o
Pie
chart
o Scatterplot o Histogram
(f) Which
statement
is
not
true
about
confidence intervals?
o A confidence interval is an interval
of
values computed from sample
data
that
is likely
to
include the
true
population
parameter
value.
o A formula for confidence interval is (sample estimate) ± (maryin
of
error).
o A confidence interval between 0.2 and 0.4 means
that
the
population
parameter
definitely lies between 0.2
and
0.4.
o A
!J9%
confidence interval is more likely
to
include
the
population
parameter
than
a
95% confidence interval.


57
MAT 221 Full Course Notes
Verified Note
57 documents
Document Summary
Formulae: sx = j(x1 ~ x}2 + (x2 - x }2 + (xa - x }2 + + (xn - x} 2 n - 1. _ 1 [(xt -x) (yl -y: r - - - - - - - - - + + - - - - (xn - x) (yn -y) ] S y: least squares regression line: y = bo + b1x where b1 = r ~ and bo = y - bi x. S:z: residual at a data point (x, y) is y - y observed y - predicted y, if x is a discrete random variable taking on values x1, , xk with respective probabilities. ,pk , then the mean is x = x1p1 + + xkpk, the variance is a} = (x1 - x ) Pt + + (xk - x ) Pk, and the standard deviation is ax = ~-