CHEM 142 Study Guide - Midterm Guide: Phase Diagram, Gasin Faith

2 Feb 2017
School
Department
Course
Professor
Document Summary
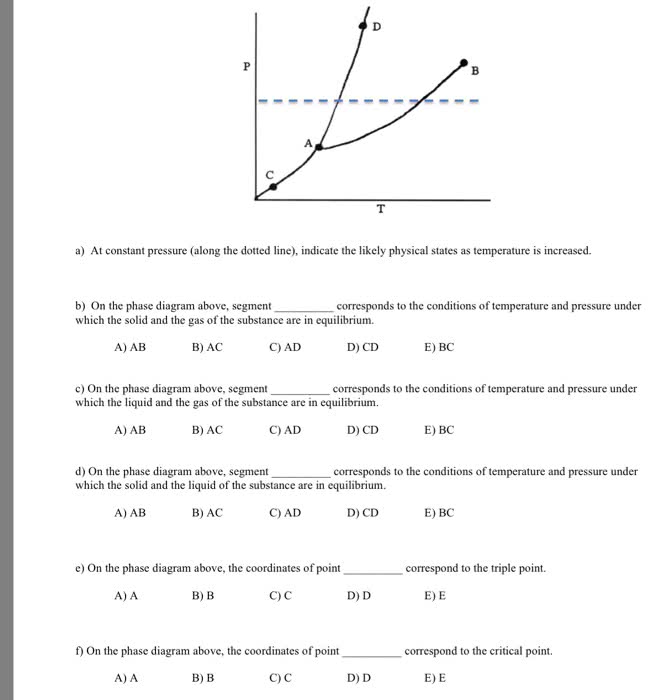
Phase diagram: a map of the state or phase of a substance as a function of pressure (on the y-axis) and temperature (on the x-axis) Triple point: represents the unique set of conditions at which the three states are equally stable and in equilibrium in a phase diagram. Critical point: represents the temperature and pressure above which a supercritical fluid exists in a phase diagram. Phase diagram: a map of the state or phase of a substance as a function of pressure (on the y-axis) and temperature (on the x-axis: draw a generic phase diagram and label its important features. Any of the three main regions solid, liquid, and gas in the phase diagram represents conditions where that particular state is stable. The triple point in a phase diagram represents the unique set of conditions at which the three states are equally stable and in equilibrium.