MATH 1150 Study Guide - Quiz Guide: Confounding

13 Mar 2017
School
Department
Course
Professor
Document Summary
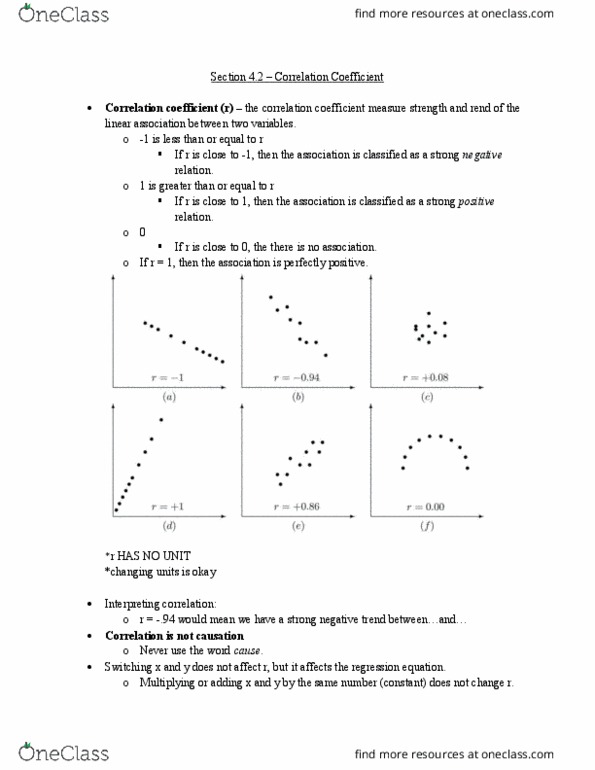
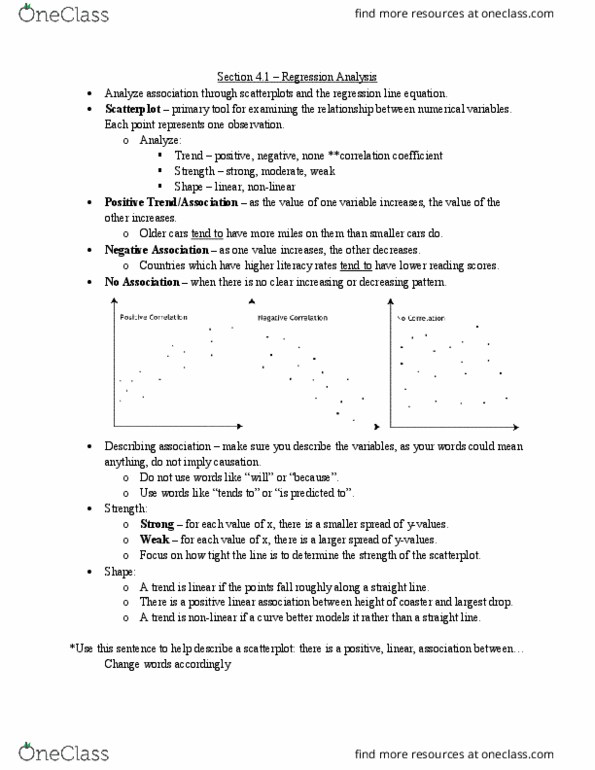
Ch 4 stats study guide between two variables. Correlation coefficient, r: measures the strength and trend of the linear association. Sample sentence: there is a strong, positive, linear relationship between the (anything that"s underlined is what would be changed from sample to sample. ) number of texts sent and the number of texts received. R must be between -1 and 1. Close to 0: weak or no relation. Between 1 and 0. 8 (-1 and -0. 8) ---> strong. Between 0. 8 and 0. 5 (-0. 8 and -0. 5) ---> moderate. Between 0. 5 and 0 (-0. 5 and 0) ---> weak. Switching x and y doesn"t affect r, but it does affect the regression equation. Multiplying all x-values (or all y values) by the same number doesn"t change r. Squaring or square rooting data values will mess up r. Only use linear correlation to interpret the data when there is a linear relationship. Regression line: a tool for making predictions about future values.