STAT 20 Study Guide - Quiz Guide: Homoscedasticity, Scatter Plot, World Health Organization


34
STAT 20 Full Course Notes
Verified Note
34 documents
Document Summary
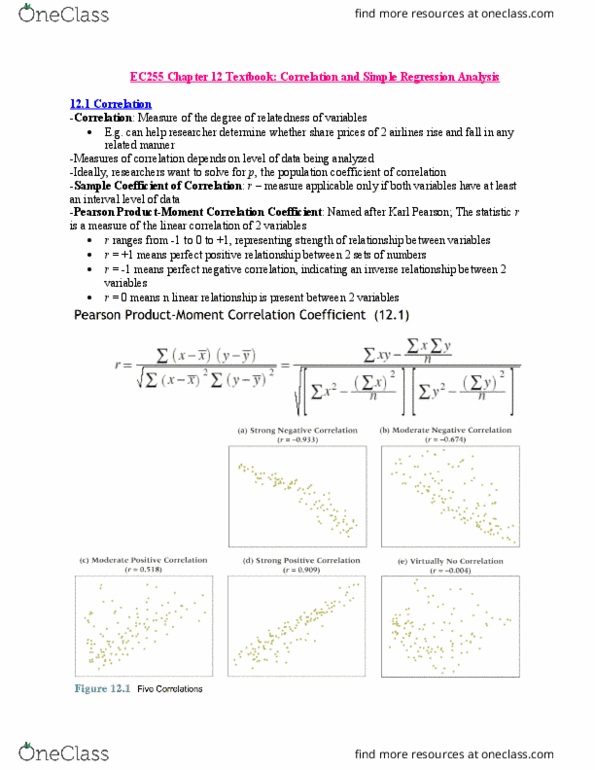
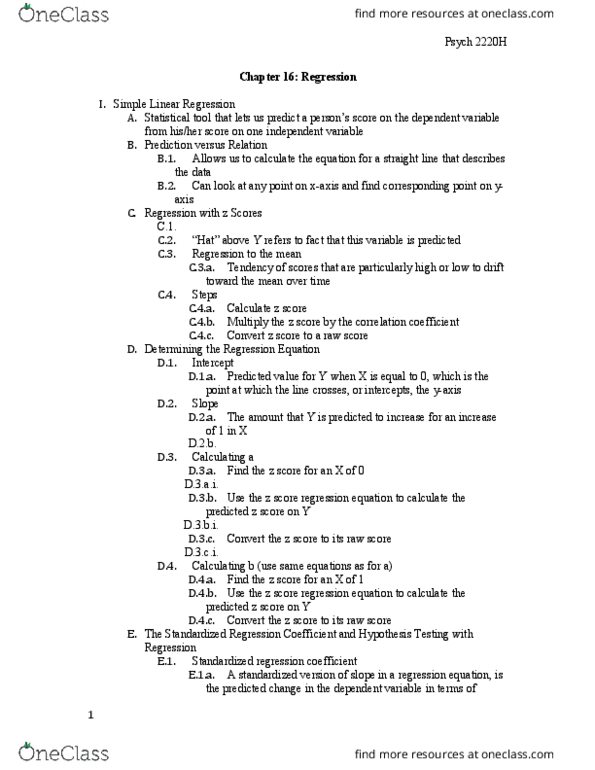
The data set shown below has a correlation of 0. Intuitively, a 0 correlation means that the regression line is horizontal and passes through the middle of the data. For this to happen, the point (4, z) has to balance out the other three points, in the sense that it pulls the regression line up to horizontal. Since the two y values for the middle points are 5, the y value for the point at x = 4 should match that of the point at x = 1 to make the graph symmetric. You can also work this out explicitly using the second formula for the correlation coe cient: (cid:80)4 i=1 xiyi x y. We can disregard the denominator, since the fraction is equal to zero only if the numerator is equal to zero. This gives us the following equation to solve: (1) llll1. 01. 52. 02. 53. 03. 54. 0024681012xy4(cid:88) i=1.