PS296 Study Guide - Midterm Guide: Null Hypothesis, Statistical Inference, Descriptive Statistics

Midterm 1 Review:
For intermediate calculations, round to 3 decimal places. Final answer = round to 2
Population parameters: mu (M), σ (SD) / sample statistics: x̅ (M), s (SD)
-we know its a correlation (as opposed to z test) if question specifies 2 variables & asks to figure
out relationship
The Research Process: (1) research idea (2) background research (3) conduct research (4) statistical
analysis (5) presentation of findings
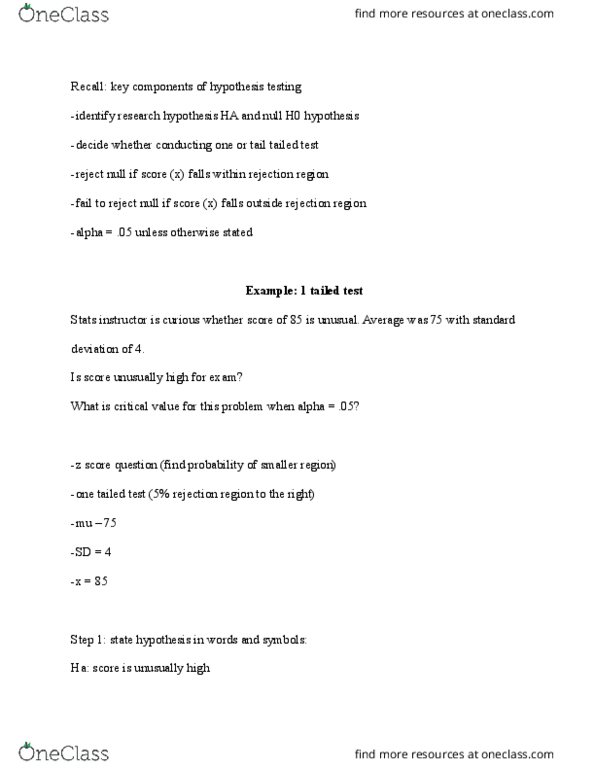
Steps: (1) identify research question (2) state research/alternative hypothesis HA (3) state null
hypothesis H0 (4) look at data been given (5) compare sample stat to sampling distribution of
mean/critical value (6) decide whether to reject/fail to reject H0 (7) describe results
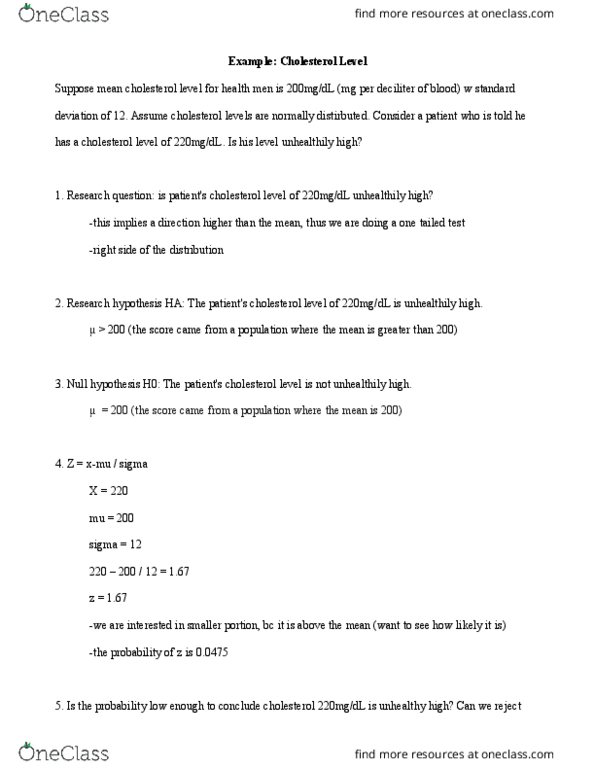
Ex: At a signifiance level of alpha = .05 (one-tailed test), for our result with p = .048, we reject the
null hypothesis and conclude that the patient with a cholesterol level of 220mg/dL has an
unhealthily high level of cholesterol (M = 200, SD = 12)
Discrete/categorical/quantitiative variables: limited number of values, whole things, can be counted
Continuous/qualitative variables: infinite number of values
Descriptive statistics: used to describe/summarize data, provide info
Inferential statistics: used to understand relationship between variables and male predictions
Parameters: numerical values associated with a population (μ = pop mean, σ = pop SD)
Document Summary
For intermediate calculations, round to 3 decimal places. Population parameters: mu (m), (sd) / sample statistics: x (m), s (sd) We know its a correlation (as opposed to z test) if question specifies 2 variables & asks to figure out relationship. The research process: (1) research idea (2) background research (3) conduct research (4) statistical analysis (5) presentation of findings. Discrete/categorical/quantitiative variables: limited number of values, whole things, can be counted. Descriptive statistics: used to describe/summarize data, provide info. Inferential statistics: used to understand relationship between variables and male predictions. Parameters: numerical values associated with a population ( = pop mean, = pop sd) Statistics: numerical values associated with a sample/subset of the population (x = mean, s = sd) Nominal scales of measurement: most basic, numbers represent categories/not significant, quantitative. Ordinal: numbers represent categories/can be ranked, quantitative data. Interval: ordinal but numbers have equal distance between them, qualitative data.