PS296 Study Guide - Midterm Guide: Pearson Product-Moment Correlation Coefficient

Pearson product-moment correlation coefficient (Pearson r)
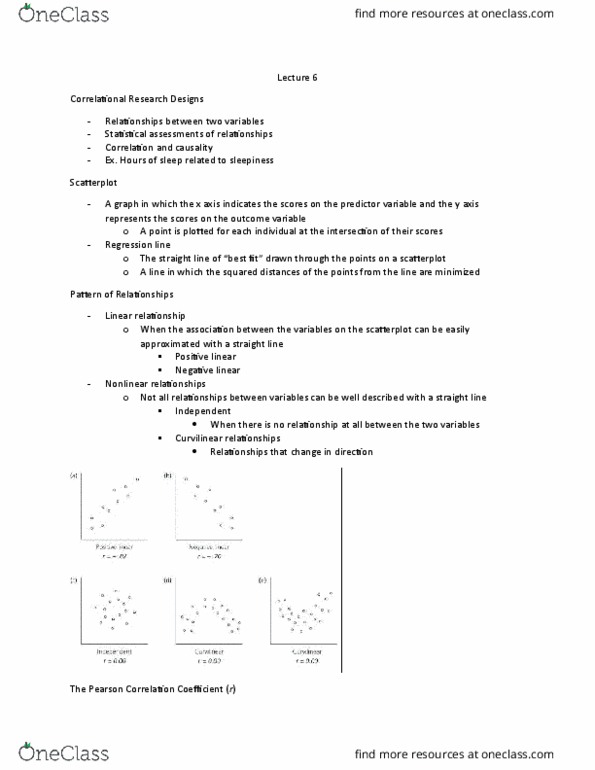
-measures linear relationships between 2 variables (r = -1.00, and r = 1.00 = perfect
correlation)
-fairly unstable with small sample sizes and is vulnerable to outliers
-(1) magnitude: how close it is to 1.00, and (2) direction: is it negative or positive? Positive
= as values of on increase/decrease, values of the other increase/decrease, negative = as
values of one increases, the other decreases
-0 correlation = horizontal, straight line
-regression line/line of best fit represents best prediction of y for any given value of x
R = .10 unreliable, .20 = small association, .30 = sufficient, .40 = moderate, .60 = good, .80
= great
-covariance = statistic that represents the degree to which x and y vary together
Writing this up: Correlation is small to moderate, and has a negative relationship. As annual
income (x) increases, happiness ratings (y) decrease in a linear fashion.
Characteristics of sample that affect r:
(1) range restrictions on x and y usually reduces r (2) non linear relationships (3)
heterogenous subsamples/sample could be divided into 2 distinct sets of data on basis of
other variable (ex M vs F)
rho (ρ)
-we use r to estimate rho (the correlation coefficient for the population)
Document Summary
Measures linear relationships between 2 variables (r = -1. 00, and r = 1. 00 = perfect correlation) Fairly unstable with small sample sizes and is vulnerable to outliers. = as values of on increase/decrease, values of the other increase/decrease, negative = as values of one increases, the other decreases. Regression line/line of best fit represents best prediction of y for any given value of x. R = . 10 unreliable, . 20 = small association, . 30 = sufficient, . 40 = moderate, . 60 = good, . 80. Covariance = statistic that represents the degree to which x and y vary together. Writing this up: correlation is small to moderate, and has a negative relationship. As annual income (x) increases, happiness ratings (y) decrease in a linear fashion. We use r to estimate rho (the correlation coefficient for the population) To check whether r is significant, we need to find critical value for alpha = . 05 for our degrees of freedom.