Economics 0011A/B Study Guide - Final Guide: Demand Curve, Midpoint Method, Negative Number

2 Aug 2020
School
Department
Course
Professor
Document Summary
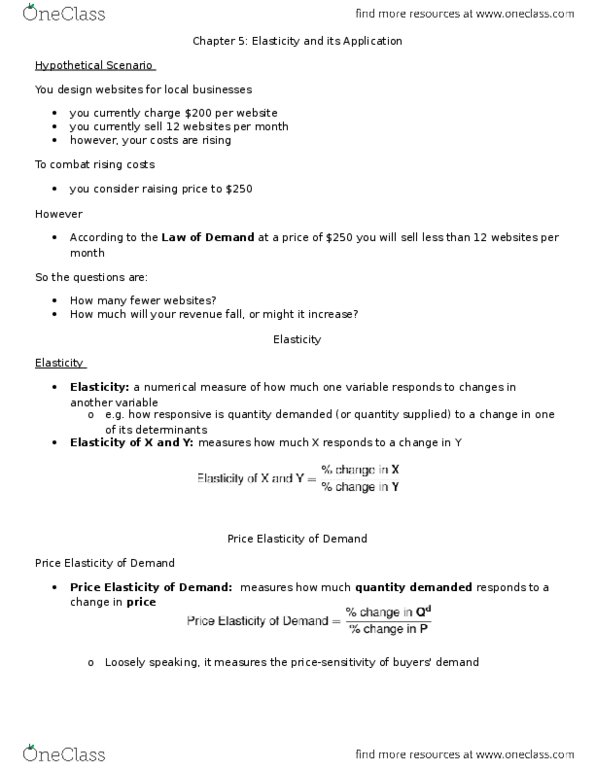
What is the price elasticity of demand (using the midpoint formula) between . 50 and . 25: 9, 19, 119, 0. 5. What is the price elasticity of demand (using the midpoint formula) between . 75 and . 50: 0. 42, 1. 50, 1. 86, 0. 08. What is the price elasticity of demand (using the midpoint formula) between sh. 75 and sh. 50: 0. 25, 0. 33, 0. 43, 0. 52. The change in total revenue resulting from a change in price from p to t suggests that demand is: inelastic, price-elastic, price-inelastic, price unit-elastic. Total revenue at point s equals the: distance 0p, distance ms, area 0tum, area 0psm. Total revenue at point v equals the: area 0tvn, area 0psvn, distance 0t, distance nv. Figure 2: demand curves: a, b, c, d. Which graph shows a perfectly inelastic demand curve: a, b, c, d. Lowest price elasticity: d1, d2, d3, d4. Between the two prices, p1 and p2, which demand curve has the. Prof. freitas, university of toronto: d2, d3, d4.