CCT319H5 Study Guide - Midterm Guide: Deflation, Underemployment, Black Market

28 Mar 2017
School
Department
Course
Professor

Document Summary
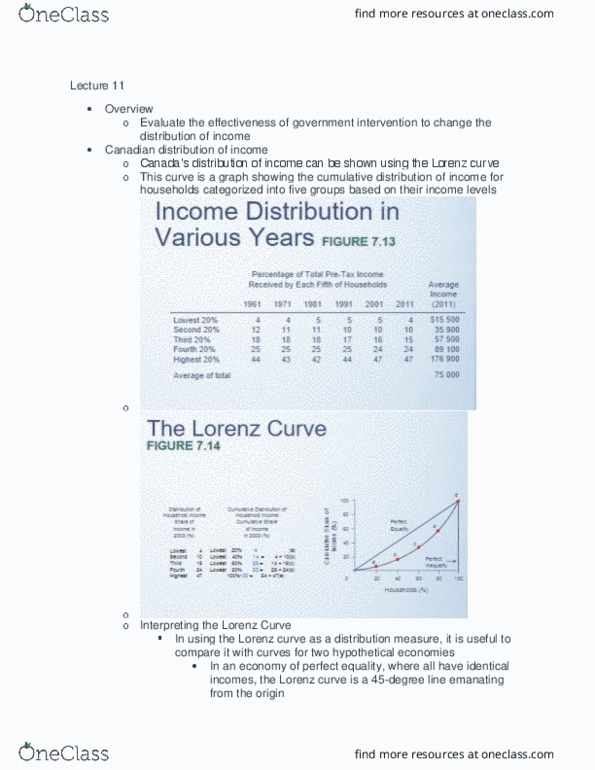
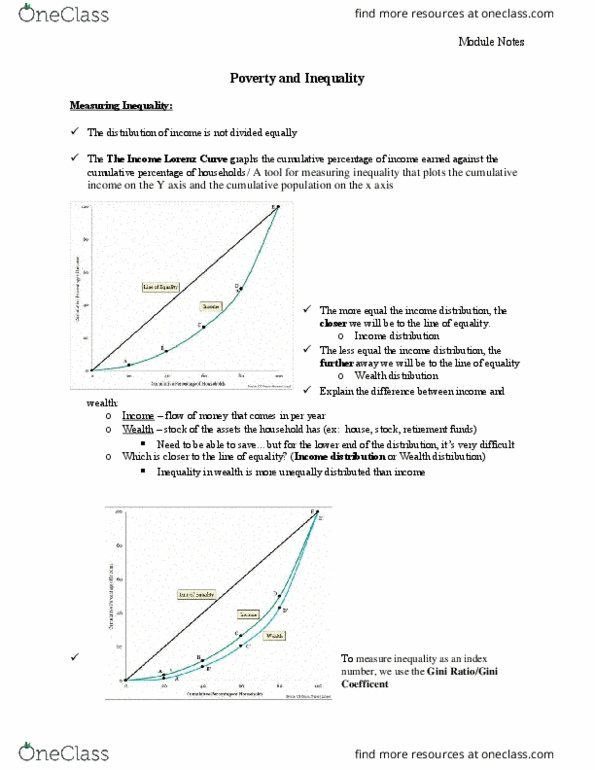
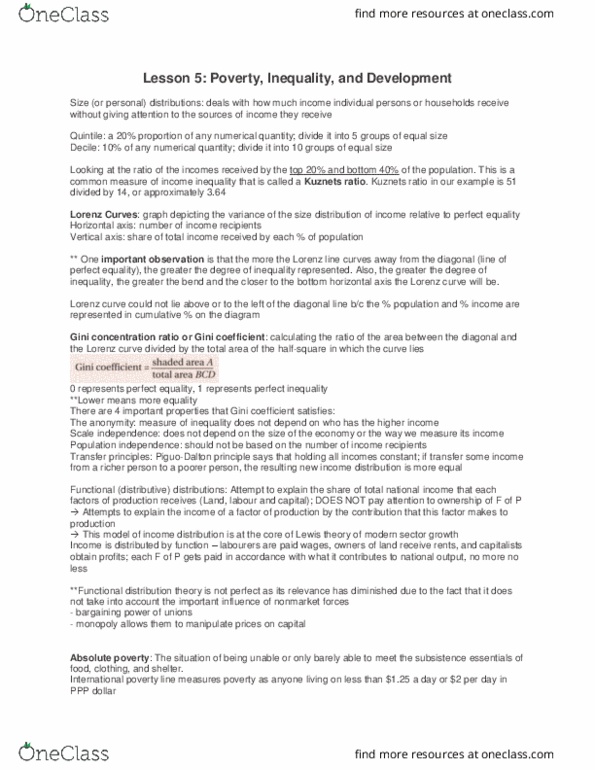
Can be shown using the lorenz curve. This curve is a graph showing the cumulative distribution of income for households categorized into 5 groups based on their income levels. > income = how $ you are bringing in; salary. The highest 20% usually has about 40% of income. Compare it with curves for 2 hypothetical economies: > economy of perfect equality: we all have the same income; it is a 45 line from the origin. > economy of perfect inequality: 1 household receives all of the economy"s income, it would follow the horizontal & vertical axis of the graph. Provides a single # value measure of income distribution. > defined as the area between a lorenz curve and the 45 line of perfect equality, divided by the entire triangular area under the 45 line. > the coefficient varies from 0-1, with 0 = perfect equality and 1 = perfect inequality. > = output per worker in a given time.