PSYC 2360 Study Guide - Midterm Guide: Multiple Comparisons Problem, Latin Square, Observational Error


Document Summary
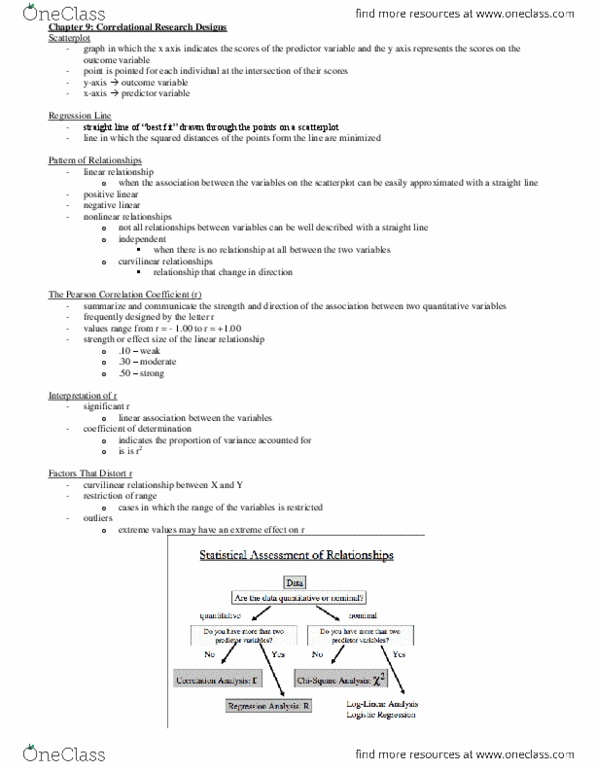
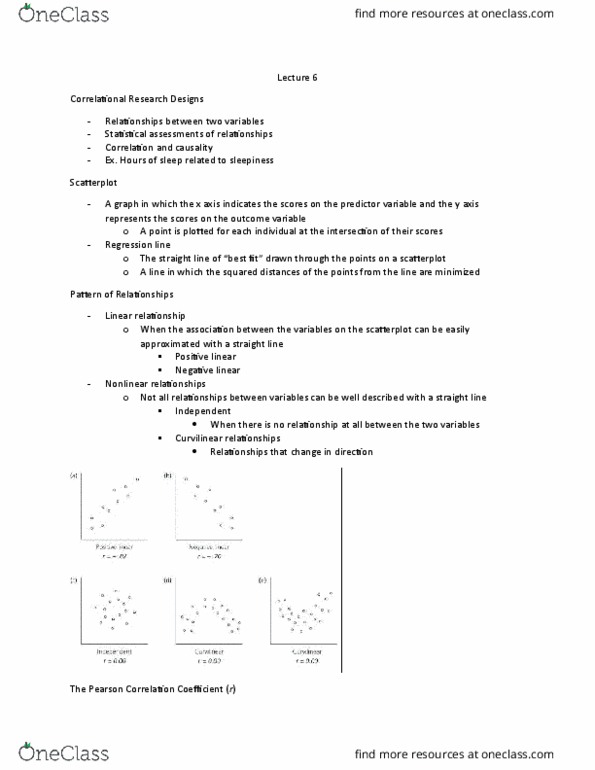
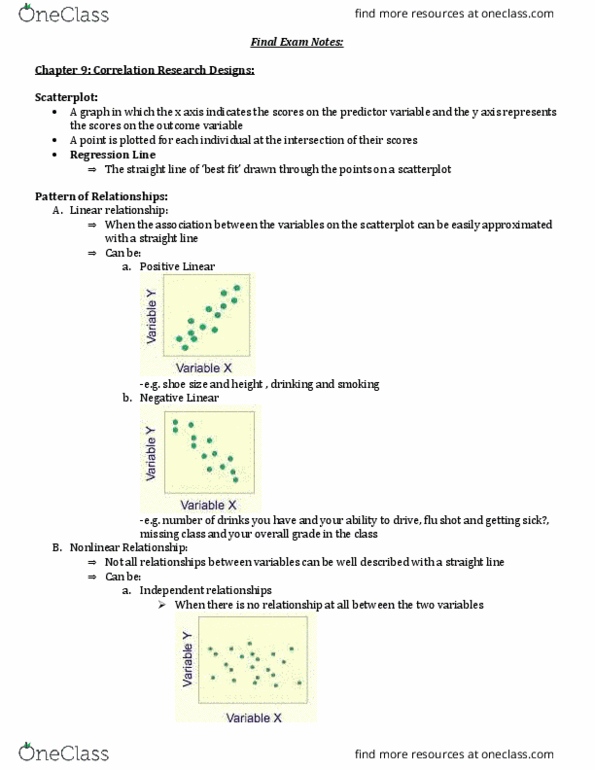
Used to search for and describe relationships. Example: relationship between diet and disease: experimental design. Manipulate one or more variables and see if they cause changes in university gpa. Association between the variables on the scatterplot equate a straight line: nonlinear relationships. Independent: there is no relationship at all between the two variables. When two variables are independent, we cannot us one variable to predict the other: curvilinear relationships: relationships that change in direction and thus are not described by a single straight line. Scatterplot: graph, by convention, predictor on the x-axis and outcome on the y axis. Research methods test #3: standardized = scaled by standard deviation. Pearson"s correlation coefficient: designated by the letter r, correlation coefficient is a number that indicates both the direction and the magnitude of association. Research methods test #3: be careful interpreting a correlation of r = 0. Limitations of r: cases in which the data have outliers.