PSYC 1010 Study Guide - Final Guide: Type I And Type Ii Errors, Confidence Interval, Null Hypothesis

29 Jun 2018
School
Department
Course
Professor

1010 exam Chapter 8
Confidence intervals
•Point estimate: summary statistic from a sample that is just one number used as an estimate of the population parameter
•Interval estimates: based on a sample statistic and provides a range of plausible values for the population parameter
Calculating Confidence intervals with Z distributions
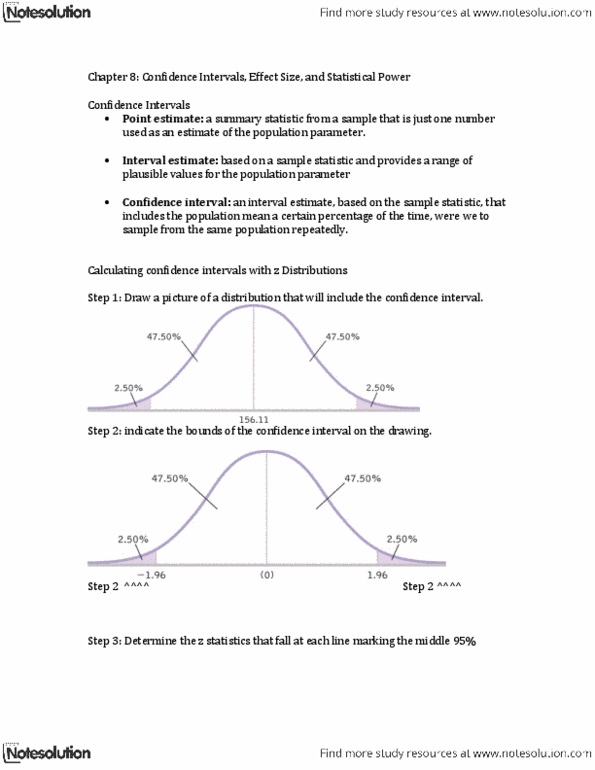
•Step1: Draw a picture of a distribution that will include the convince interval
•Step2: Indicate the bounds of the confidence interval on the drawing
•Step3: Determine the z statistics that fall at each line marking the middle 95%
•(1-.95)/2=0.025 —> 2.5% { look at z score } the z score would be 1.96
•Step4: Turn the z statistics back into raw means
•positive/negative z score x standard error+ sample size
M
lower
: -1.96 (6.36) + 232 = -12.46 + 232 = 219.54
M
upper
: 1.96 (6.36) + 232 = 12.46 + 232 = 244.46
•broken down to [219.54,244.46]
•Step5: Check that the confidence interval makes sense
{ 219.54 - 232= -12.46 and 244.46- 232= 12.46} (margin of error is 12.46)
What Effect Size is
•Effect size: indicates the size a difference and is unaffected by sample size
•how much two populations do not overlap, the less overlap, the bigger the effect size
•Amount of overlap between two distribution can be decreased in two way;
•1) Overlap decreases and effect size increases when means are further apart
•2) Overlap decreases and effect size increases when variability within each distribution of scores is smaller
Cohen’s D
•When we conduct a z test, the effect-size statistic is typically Cohen’s D
•Cohen’s D: is a measure of effect size that assess the difference between two means in terms of standard deviation ( not standard error)
•Formula,
Meta-Analysis
•Meta-Analysis: a study that involves the calculation of a mean effect size from the individual
effect fixed of many studies
Statistic Power
•Measure of the likelihood that we will reject the null hypothesis, given that the null
hypothesis is false
•The probability that we will not make a Type II error
Five Factors That Affect Statistical Power
•1. Increase alpha {statistical power increases when we increase a p level of 0.05 to 0.10.
Side effect of increasing is the probability of the Type I error from 5%-10%
•2. Two tails hypothesis into one tailed. More statistical power, but 2 tail is more common
•3. Increase sample leads to an increase in the test statistic, making it easier to reject the
null hypothesis
•4. Exaggerate the mean difference between levels of the independent variable.
•5. Decrease standard deviation= reducing error
d = (M – μ)
σ
Document Summary
Point estimate: summary statistic from a sample that is just one number used as an estimate of the population parameter. Interval estimates: based on a sample statistic and provides a range of plausible values for the population parameter. Step1: draw a picture of a distribution that will include the convince interval. Step2: indicate the bounds of the confidence interval on the drawing. Step3: determine the z statistics that fall at each line marking the middle 95% (1-. 95)/2=0. 025 > 2. 5% { look at z score } the z score would be 1. 96. Step4: turn the z statistics back into raw means positive/negative z score x standard error+ sample size. : -1. 96 (6. 36) + 232 = -12. 46 + 232 = 219. 54 lower. : 1. 96 (6. 36) + 232 = 12. 46 + 232 = 244. 46 upper broken down to [219. 54,244. 46] Step5: check that the confidence interval makes sense. { 219. 54 - 232= -12. 46 and 244. 46- 232= 12. 46} (margin of error is 12. 46)