STAT235 Study Guide - Midterm Guide: Bar Chart, Frequency Distribution, Skewness

12 Oct 2016
School
Department
Course
Professor
Document Summary
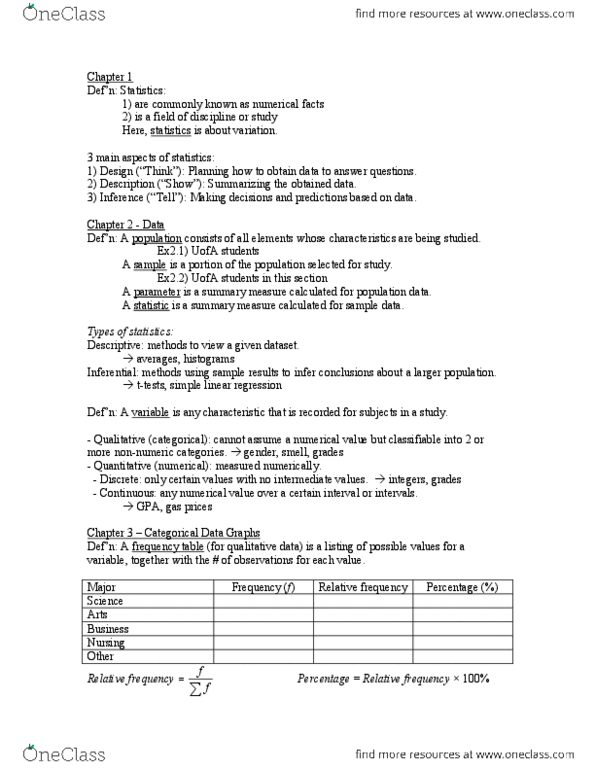
The science of collecting, analyzing, and drawing conclusions from data. Methods using sample results to infer about a larger population. Cannot assume a numerical value but can classify into two or more categories. Any characteristic that is recorded for subjects in study. Discrete: only certain values with no intermediate values (grade value, people, shoe size) Continuous: any numerical values over a certain interval(s) (gpa, temperature, age) Consists of all elements whose characteristics are being studied. Elements can be both a sample and a population. The number of times the event occurred in an experiment or study. A graph of bars whos height represents the relative frequencies of respective categories. Arranges the categories in order of decreasing frequency. Circle divided into portions that represent relative frequency belonging to different categories. Look for categories that form large and small proportions of the data set. A list of non-overlapping intervals, together with the number of observations for each interval (class or bin)